AUD/NZD Price Forecast: Potentially forming bearish reversal pattern
- AUD/NZD is probably forming a bearish reversal pattern after peaking in late November.
- The MACD could be about to offer a sell signal reinforcing the pattern.
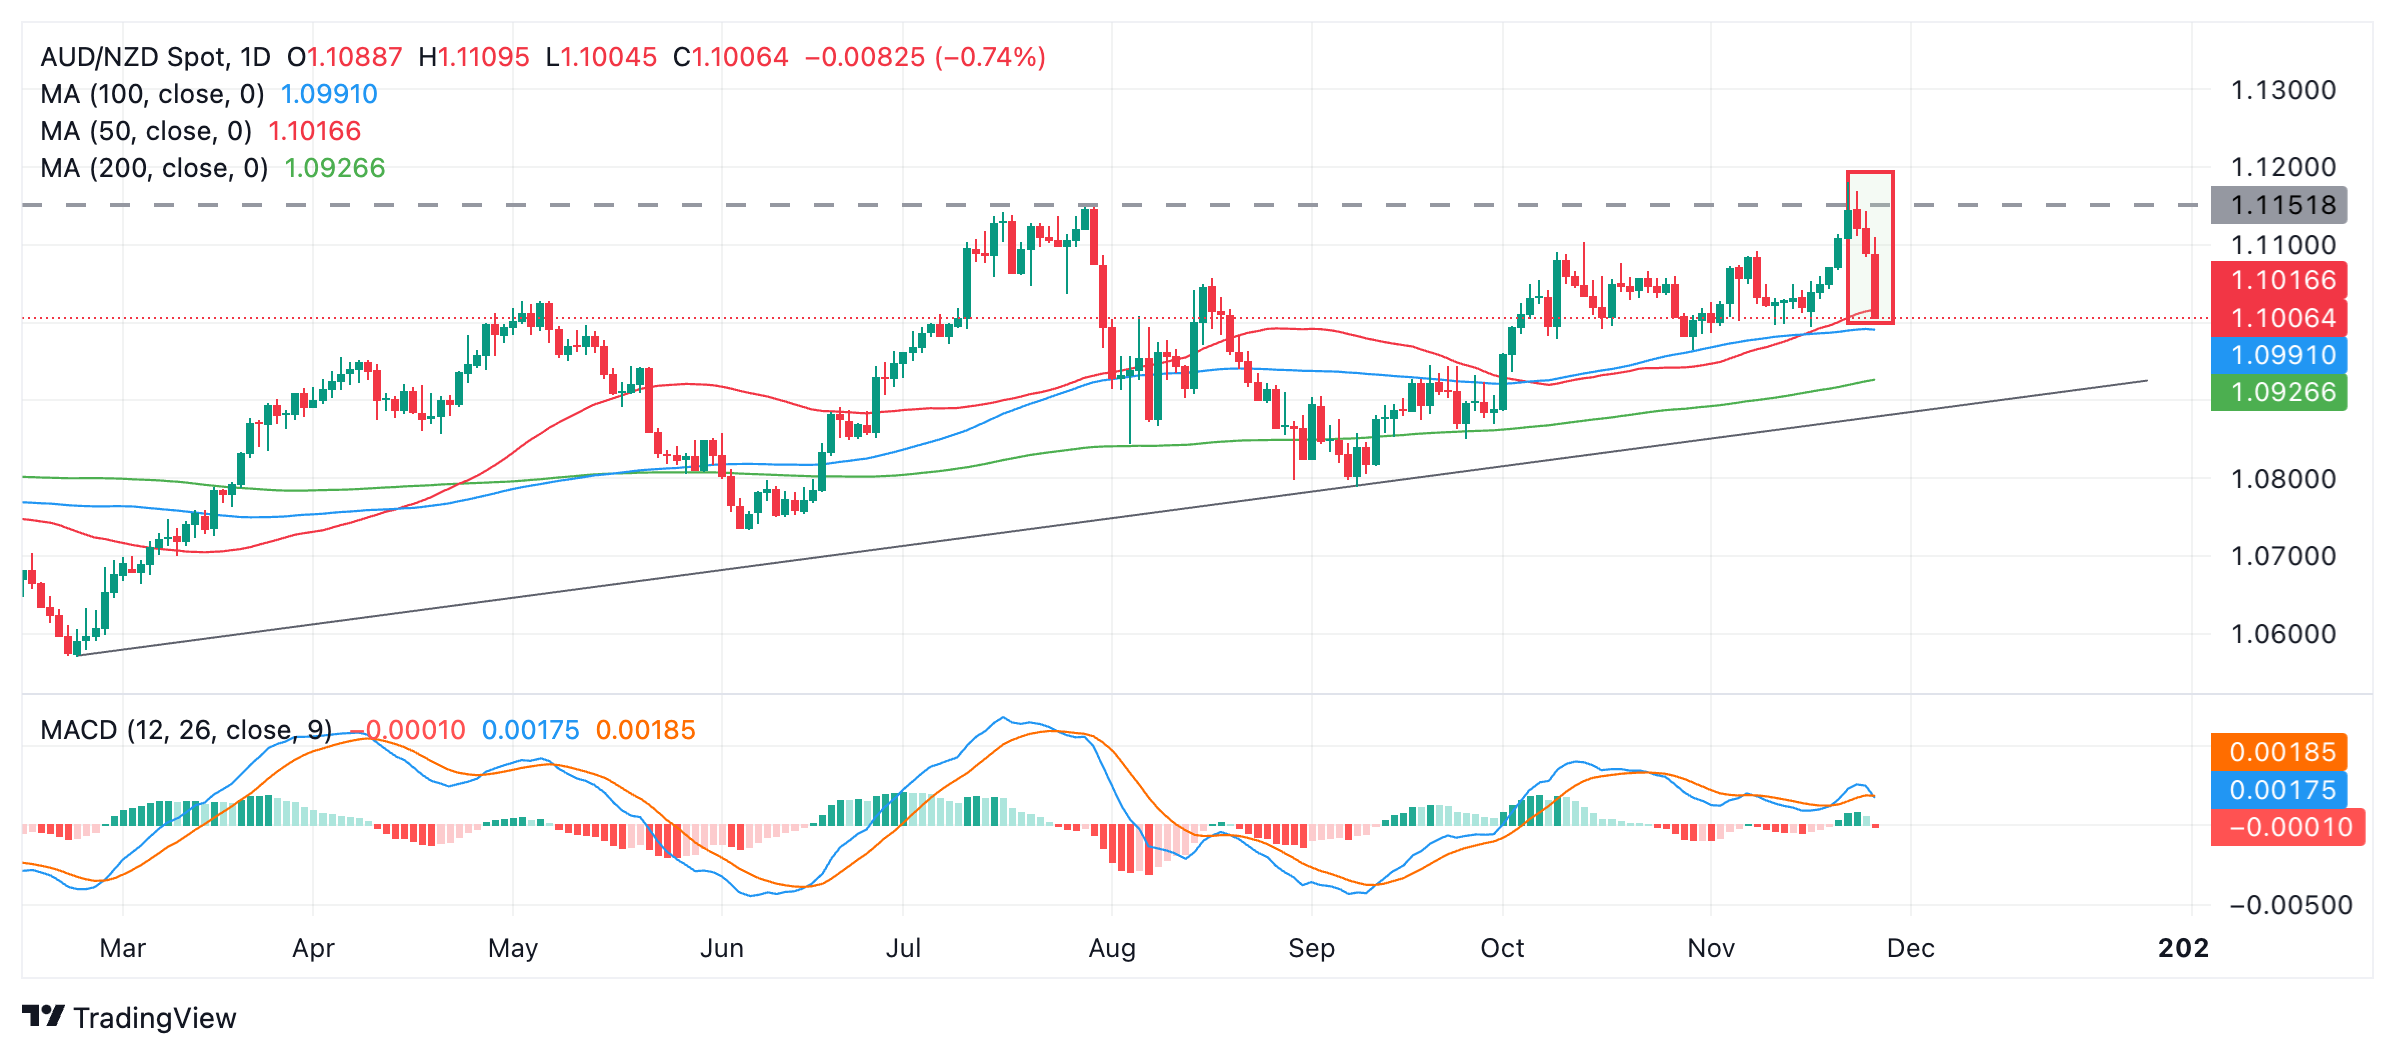
AUD/NZD has fallen for the third consecutive day after peaking at the November 25 multi-month high.
If Wednesday ends with a bearish close it will signal the completion of a bearish Three Black Crows candlestick reversal pattern (red rectangle on chart). Such a pattern would indicate the odds favor AUD/NZD falling to lower lows.
AUD/NZD Daily Chart
The (blue) Moving Average Convergence Divergence (MACD) is crossing below its red signal line, giving a sell signal and reinforcing the bearish candlestick pattern. The crossover is only on an intraday basis, however, and MACD would need to end the day below the signal line to confirm the bearish bias.
Support lies at around 1.0900 – 1.0920 at the trendline for the broader uptrend. Assuming the pattern and MACD signal are confirmed, price will probably fall to that zone and consolidate.

