Back
15 Nov 2018
Crude Oil WTI Technical Analysis: Black Gold stabilizing after the recent carnage and climactic sell-off - Bull target at $59.00 a barrel
Crude oil weekly chart
- Crude oil has erased the yearly gains as it plunged below the 58.00 level.
-636779107148827218.png)
Crude oil 4-hour chart

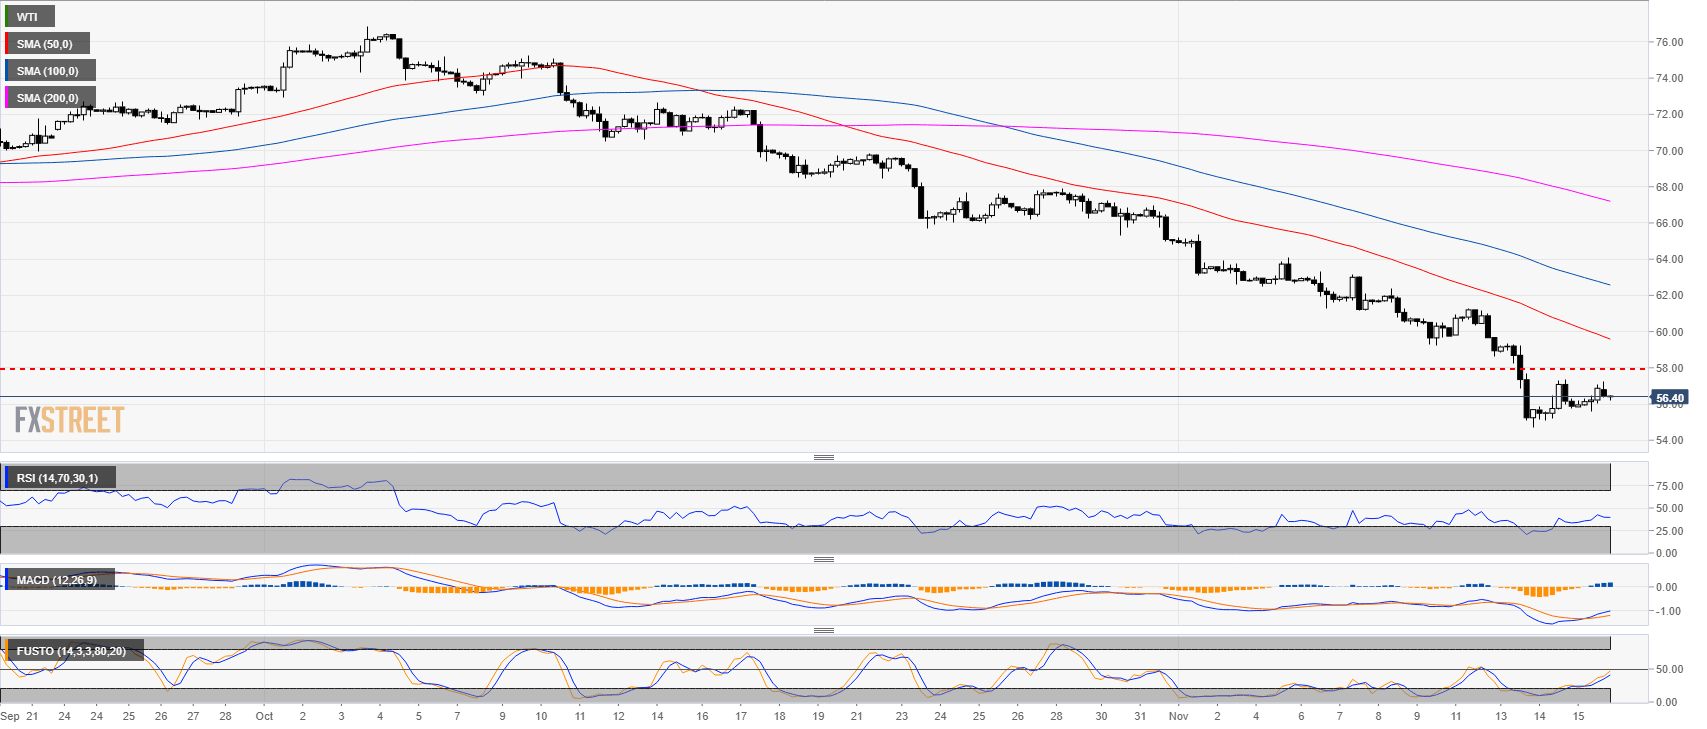
- Oil is trading in a steep bear trend below the 50, 100 and 200-period simple moving average.
- The MACD indicator crossed over from below while the RSI and Stochastic are rising but still below the 50 line.
- Oil is far away from its 50 SMA. All suggesting potential oversold condition.
Crude oil 30-minute chart

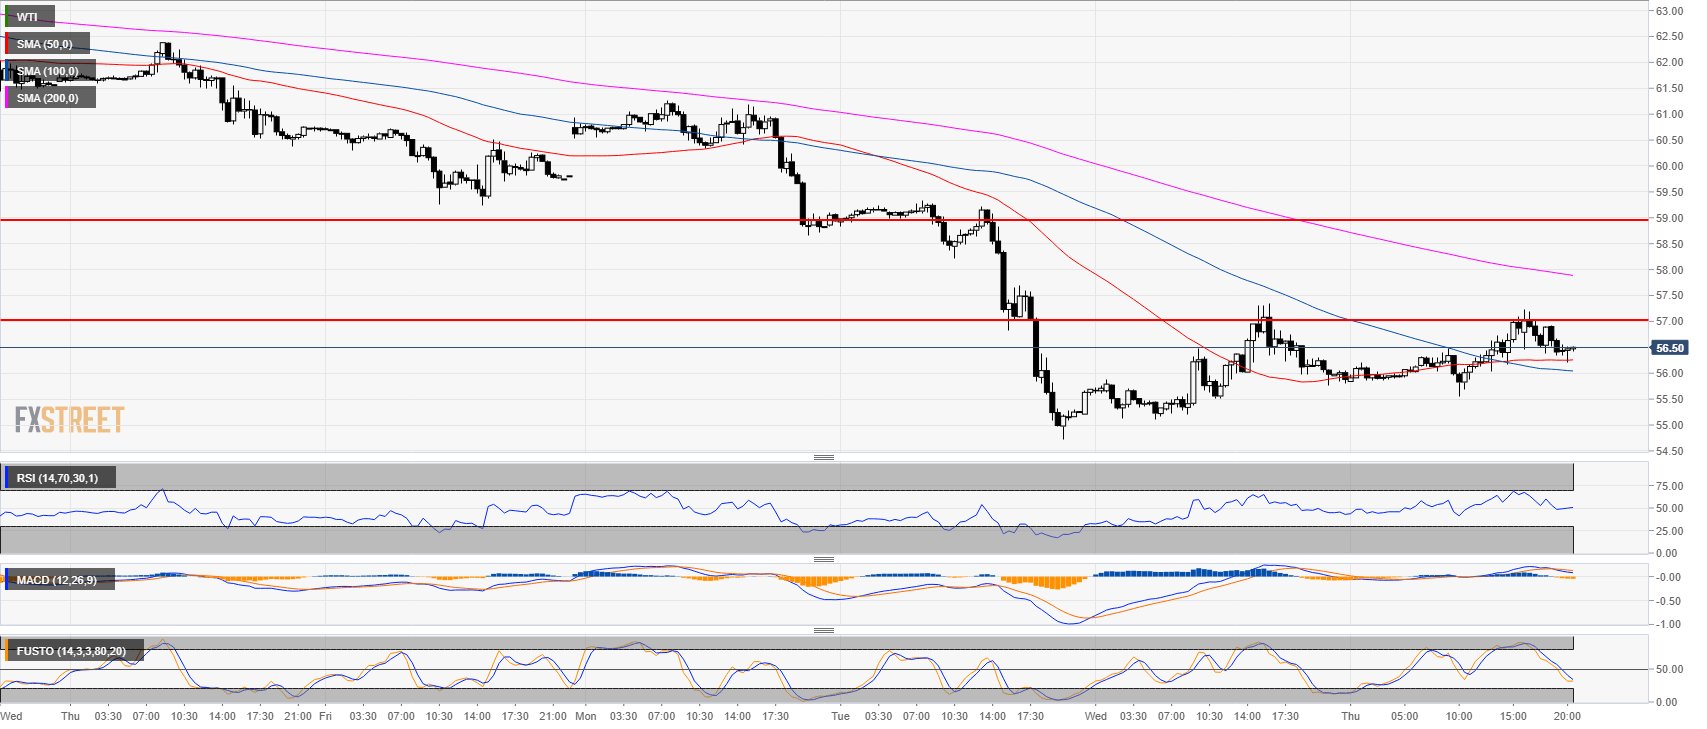
- Bulls are trying to break above $57.00 a barrel. They tried to do so on Wednesday and this Thursday.
- The 50 and 100 SMA are supporting the market.
- A successful break would most likely lead to a strong bullish recovery to 59.00.
Additional key levels at a glance:
WTI
Overview:
Last Price: 56.47
Daily change: 59 pips
Daily change: 1.06%
Daily Open: 55.88
Trends:
Daily SMA20: 63.01
Daily SMA50: 68.5
Daily SMA100: 68.37
Daily SMA200: 68.35
Levels:
Daily High: 56.06
Daily Low: 55.81
Weekly High: 63.05
Weekly Low: 59.24
Monthly High: 76.25
Monthly Low: 64.86
Daily Fibonacci 38.2%: 55.91
Daily Fibonacci 61.8%: 55.96
Daily Pivot Point S1: 55.77
Daily Pivot Point S2: 55.67
Daily Pivot Point S3: 55.52
Daily Pivot Point R1: 56.02
Daily Pivot Point R2: 56.17
Daily Pivot Point R3: 56.27
