EUR/USD Technical Analysis: Euro is afloat above the 1.1380 support
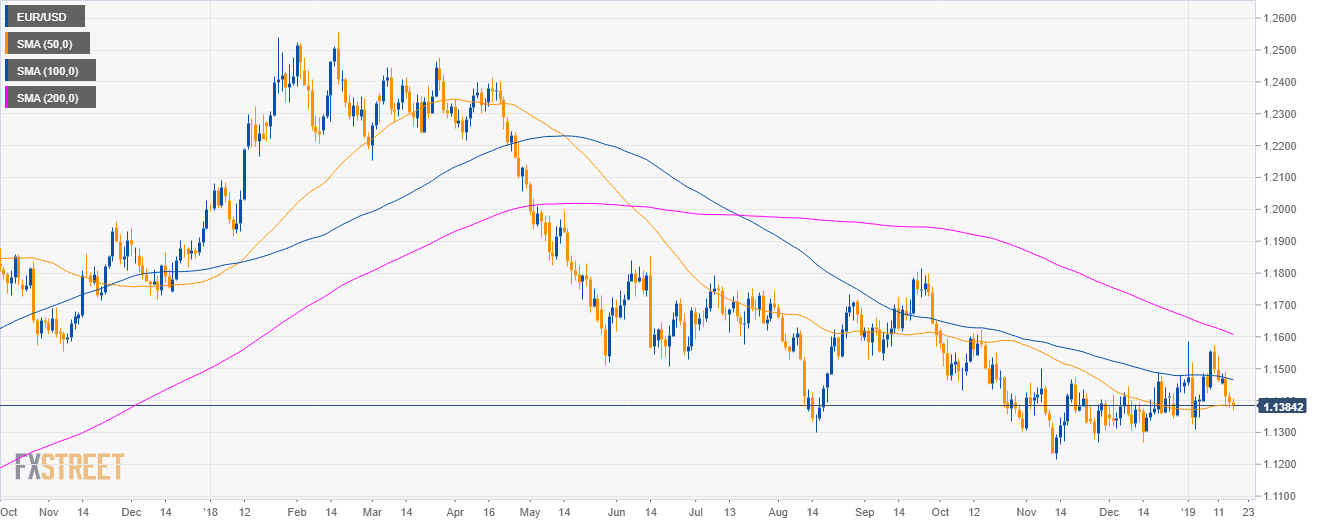
EUR/USD daily chart
- EUR/USD is trading in a bear trend below the 100 and 200-day simple moving averages (SMAs) as bears are testing the 50 SMA near the 1.1380 level.
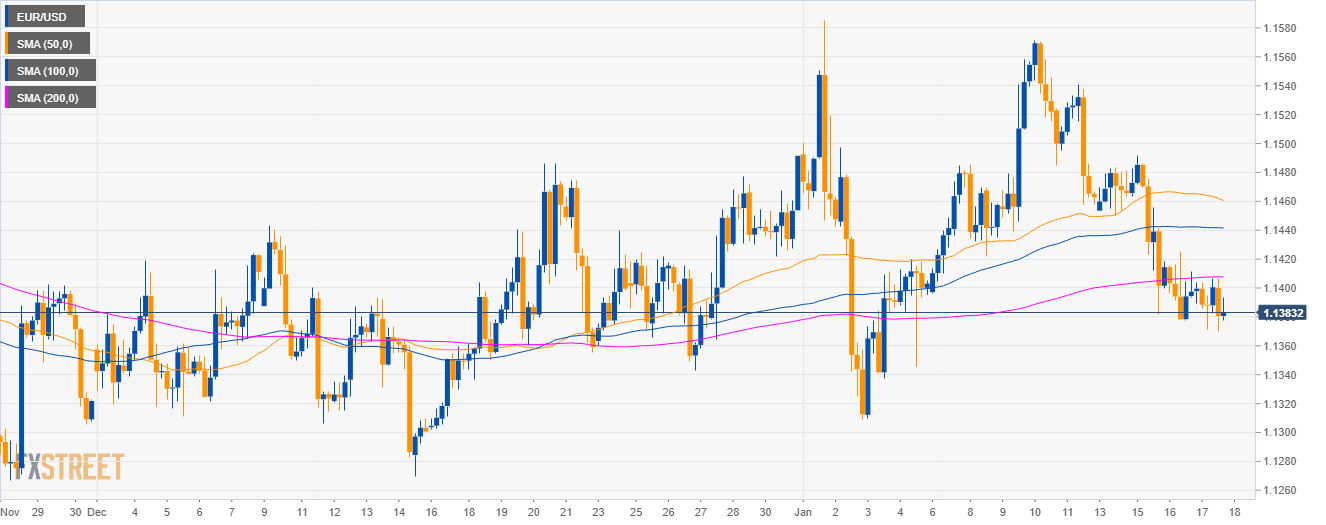
EUR/USD 4-hour chart
- EUR/USD is trading below its main SMAs just below the 1.1400 figure.
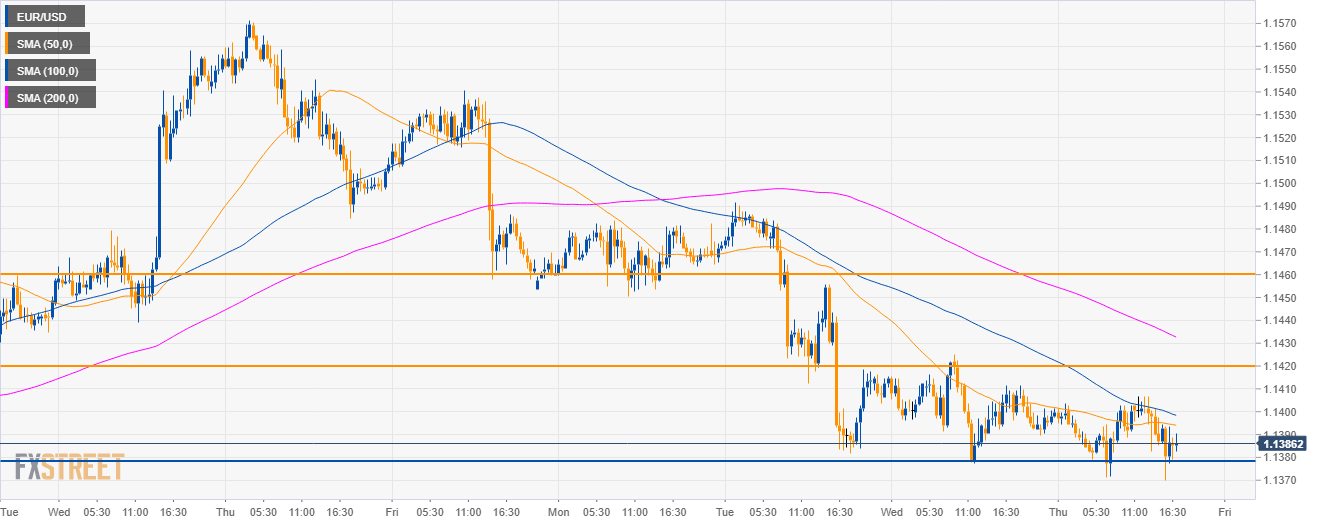
EUR/USD 30-minute chart
- EUR/USD is trading below its main SMAs as bears are trying to break below the 1.1380 support.
- EUR/USD is set to revisit 1.1420 and a break of the resistance would lead to 1.1460 level in the coming sessions.
- A break of 1.1380 to the downside would likely open the doors to a move to 1.1350 level.
Additional key levels
EUR/USD
Overview:
Today Last Price: 1.1385
Today Daily change: -7 pips
Today Daily change %: -0.0702%
Today Daily Open: 1.1393
Trends:
Daily SMA20: 1.1433
Daily SMA50: 1.1384
Daily SMA100: 1.1468
Daily SMA200: 1.1614
Levels:
Previous Daily High: 1.1425
Previous Daily Low: 1.1378
Previous Weekly High: 1.1571
Previous Weekly Low: 1.1396
Previous Monthly High: 1.1486
Previous Monthly Low: 1.1269
Daily Fibonacci 38.2%: 1.1396
Daily Fibonacci 61.8%: 1.1407
Daily Pivot Point S1: 1.1372
Daily Pivot Point S2: 1.1351
Daily Pivot Point S3: 1.1324
Daily Pivot Point R1: 1.1419
Daily Pivot Point R2: 1.1446
Daily Pivot Point R3: 1.1467