Back
22 Mar 2019
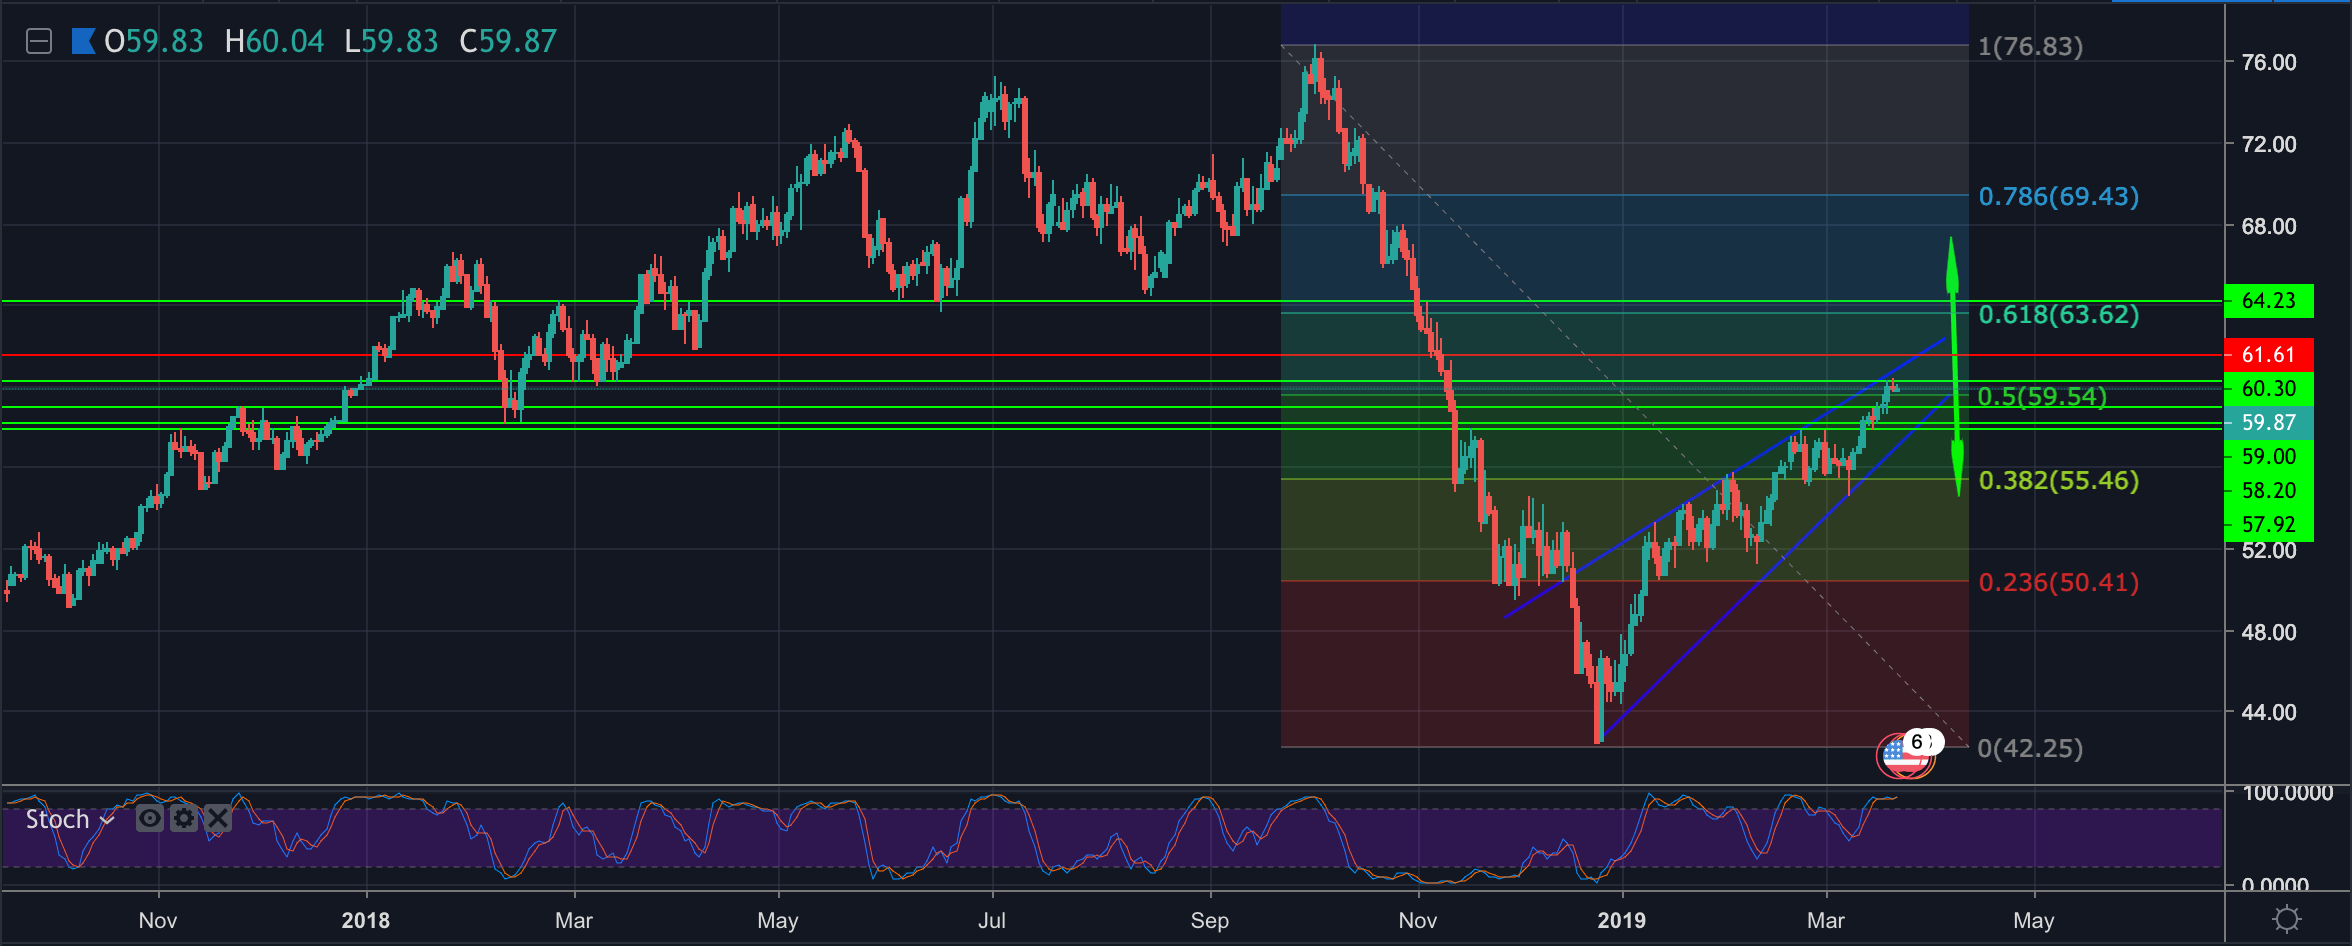
WTI Technical analysis: Rising wedge potential scenarios
- WTI's technical outlook remains bullish while the price keeps above the double-top highs and above the 57.93 horizontal prior resistance line going back to mid-Nov 2018.
- However, the daily stochastics leans bearish for a pullback within the rising wedges structure to target 59 the figure.
- In recent sessions, the price has moved beyond 58.20 and the trendline support prior resistance of 59.
- If 59 holds, Bulls will look to the 61.8% Fibo of the Oct 2018 sell-off to late Dec lows around the 63.60/70 area again, reviving prospects for the 70 handle on a break above 64.20.
- A drop to 57.92 and below the wedge will open the case for a clean breakout to target 54.50 initially and 50.40/50 area as being the 23.6% Fibo support structure.