Back
8 Oct 2019
US Dollar Index Technical Analysis: The weekly range appears supported by the 21-day SMA
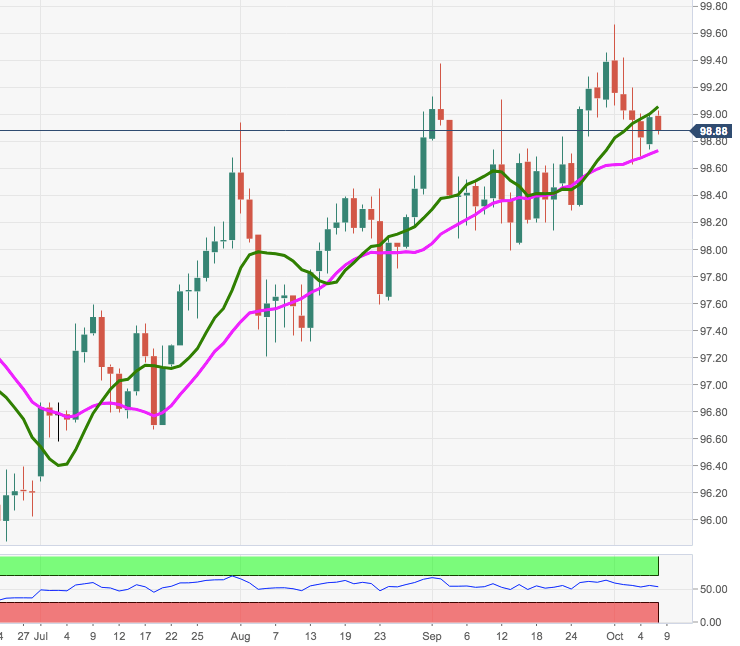
- DXY has faded the optimism seen at the beginning of the week and is now back to the 98.90/80 region.
- The 21-day SMA at 98.71 continues to underpin the price action in the Greenback for the time being, although DXY needs to surpass the 10-day SMA just above 99.00 the figure to re-assert the bullish view.
- Immediately above emerges the initial resistance at early September peak at 99.37 seconded by the 2019 high near 99.70.
DXY daily chart

