Back
25 Nov 2019
USD/JPY Technical Analysis: 109.00 target hit - 110.00 handle is next on the bulls’ radar
- USD/JPY is ending the first day of the week near the 109.00 handle.
- The level to beat for bulls is the 109.01 resistance.
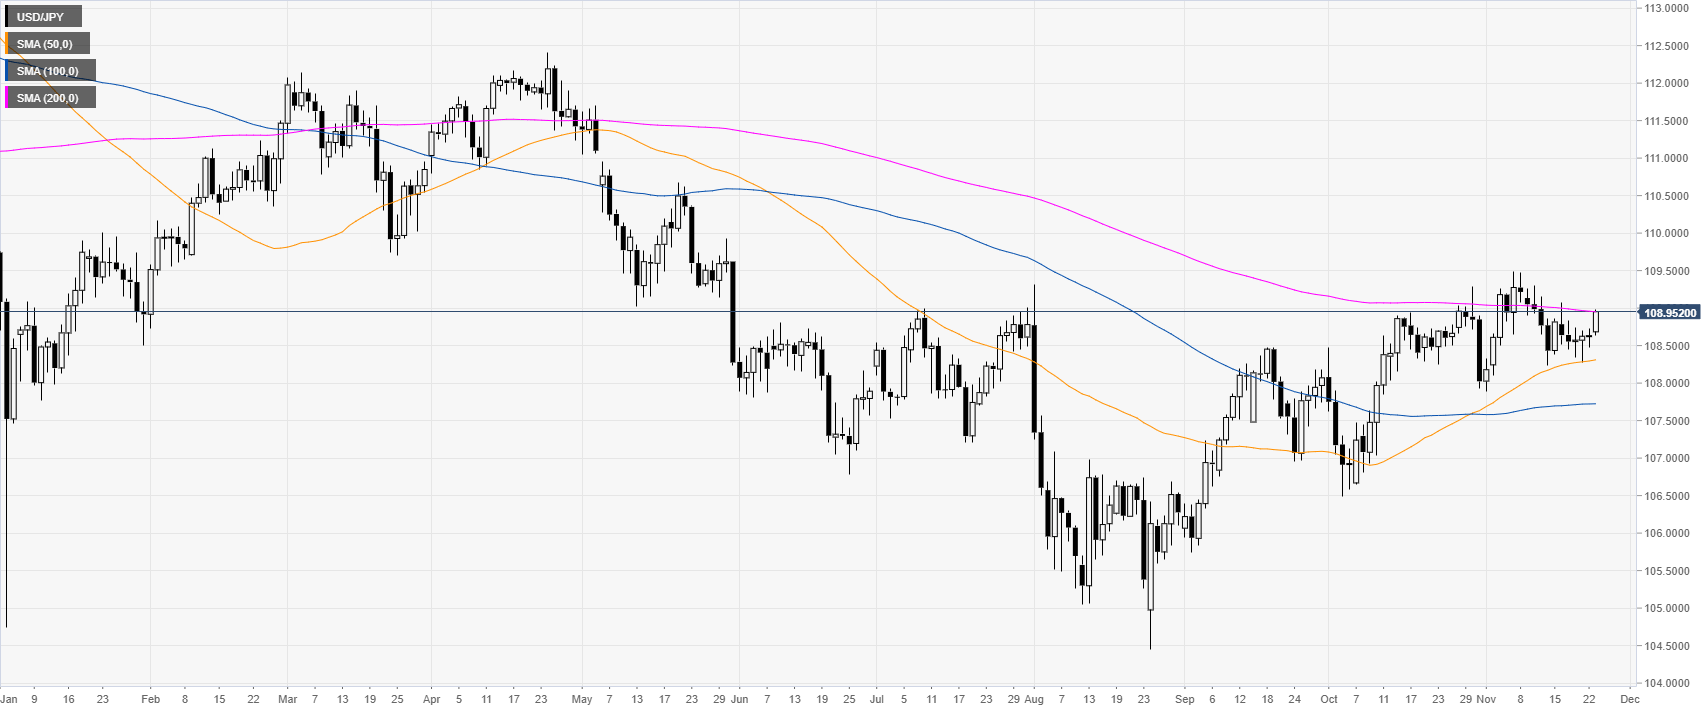
USD/JPY daily chart
USD/JPY is flirting with the 109.00 handle while testing the 200-day simple moving average (DMA) on the daily chart. In the last three months, the market has been gaining strength. As mentioned last Wednesday, USD/JPY is about to hit the 109.00 handle.
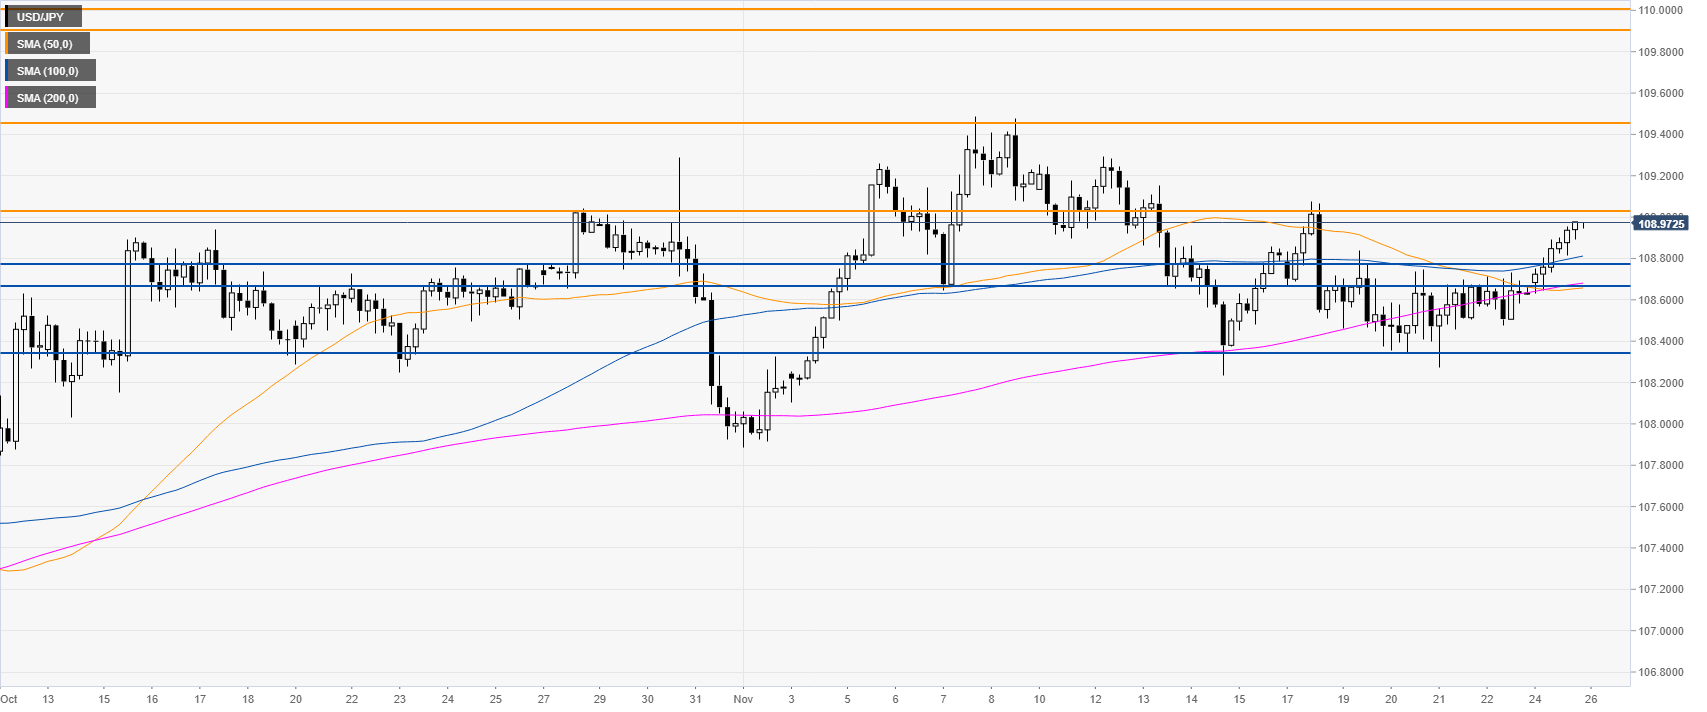
USD/JPY four-hour chart
USD/JPY is about to challenge the 109.01 level while trading above the main SMAs. A break above the level can drive the market towards 109.46 level and the 109.92/110.00 resistance zone, according to the Technical Confluences Indicator.
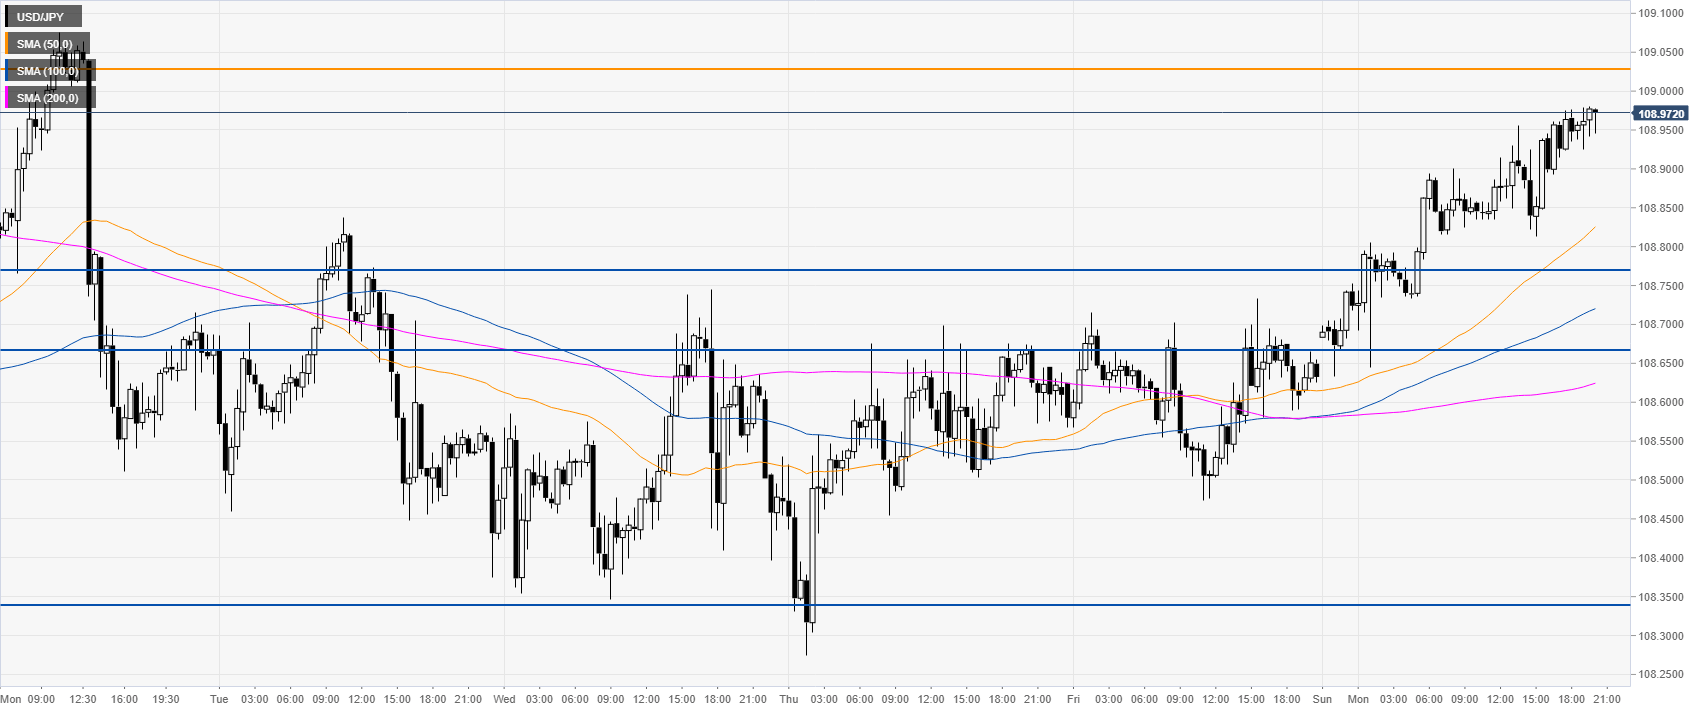
USD/JPY 30-minute chart
USD/JPY is climbing up above the main SMAs on the 30-minute chart. Support is seen at the 108.66/78 zone and 108.33 level, according to the Technical Confluences Indicator.
Additional key levels