Back
24 Mar 2020
US Dollar Index Price Analysis: DXY consolidates gains, trades near 102.00 figure
- DXY is consolidating gains after an above-average spike up.
- The level to beat for bulls is the 103.00 figure.
- The Fed launched the largest stimulus program in history to counter the coronavirus crisis, this Monday.
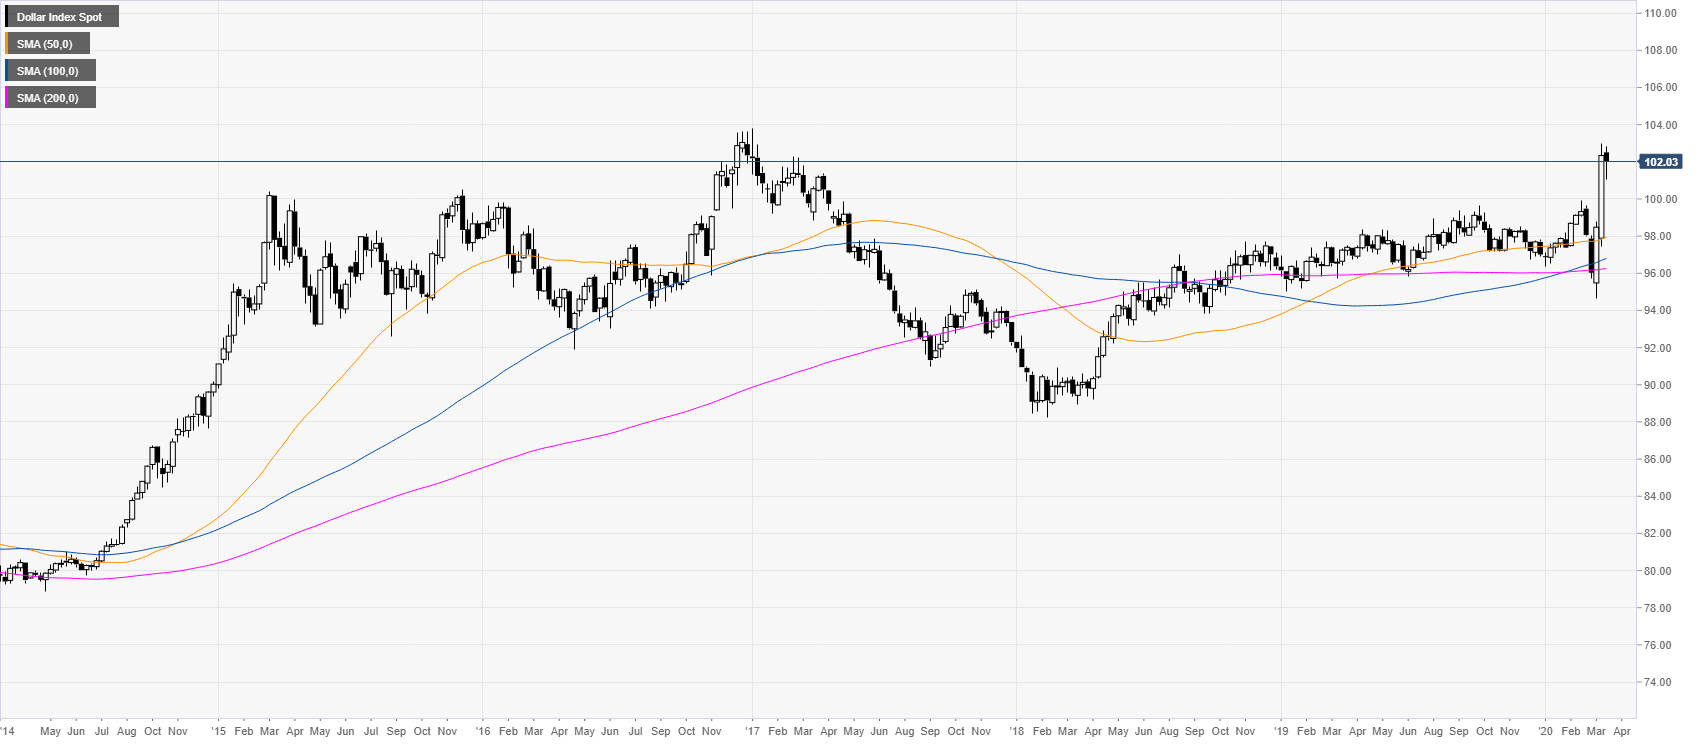
DXY weekly chart
DXY (US dollar index) is trading close to its highest point since January 2017 as USD is boosted by exceptional buying interest. As a matter of fact, the 2020 stock crash is one of the steepest and fastest declines ever experienced. As a result, the Federal Reserve of the United States announced this Monday that there would be no limit to how much it will support the US economy via Quantitative Easing (QE). All-in)all, this means more USD printing which should, theoretically, weaken the US dollar, however by introducing QE unlimited, the Fed is attracting investors which buy USD-denominated assets. This Tuesday, DXY may also react if a US government stimulus deal is sealed.
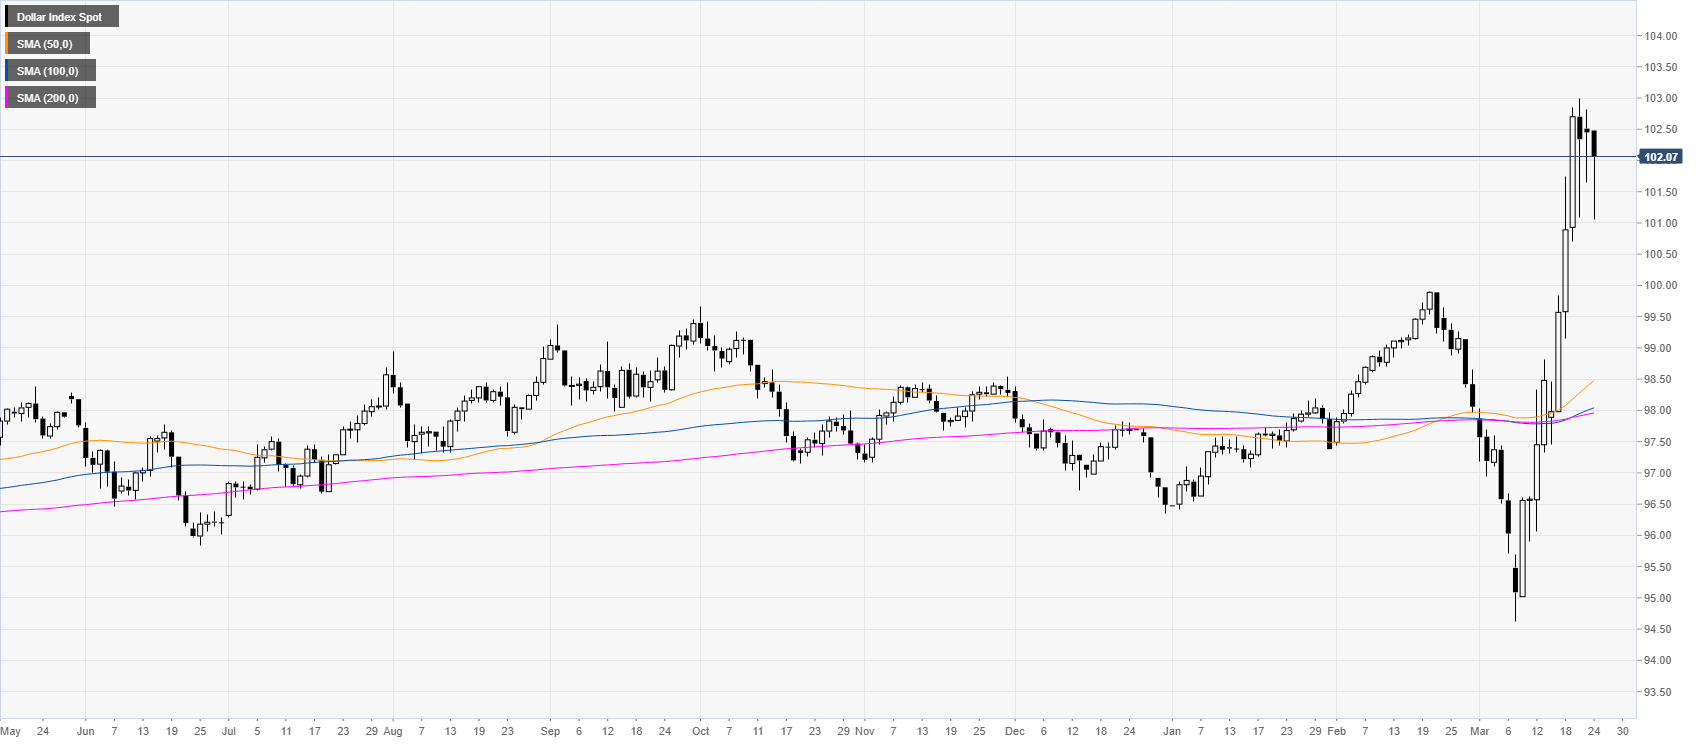
DXY daily chart
DXY is entering its third day of consolidation after an exceptionally strong spike to the upside. The pullback down remains, for now, shallow and suggests potentially higher prices ahead.
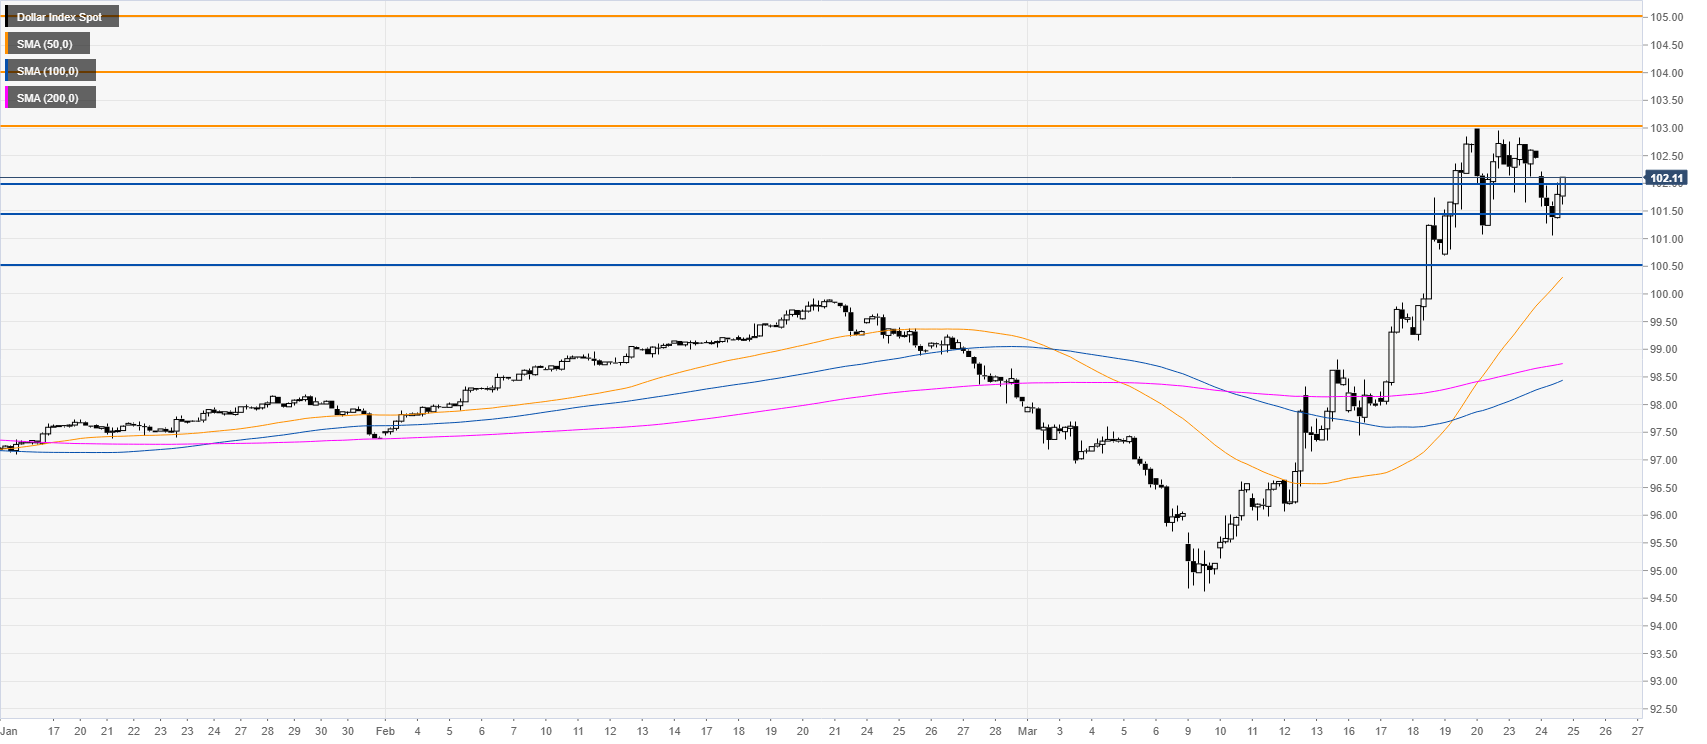
DXY four-hour chart
The uptrend remains intact as DXY is trading above the main SMAs. Retracements are remaining shallow as DXY stays in high demand. Buyers are looking for a break beyond the 103.00 resistance which could introduce scope to the 104.00 and 105.00 figures in the coming sessions or weeks. The greenback is expected to find support near the 102.00, 101.50 and 100 levels on the way down.
Additional key levels