AUD/JPY Price Analysis: MACD turns bullish after a month, eyes on 21-day SMA
- AUD/JPY remains upbeat around an eight-day high.
- Sustained trading beyond 10-day SMA, bullish MACD favor buyers.
- 23.6% Fibonacci retracement adds to the support.
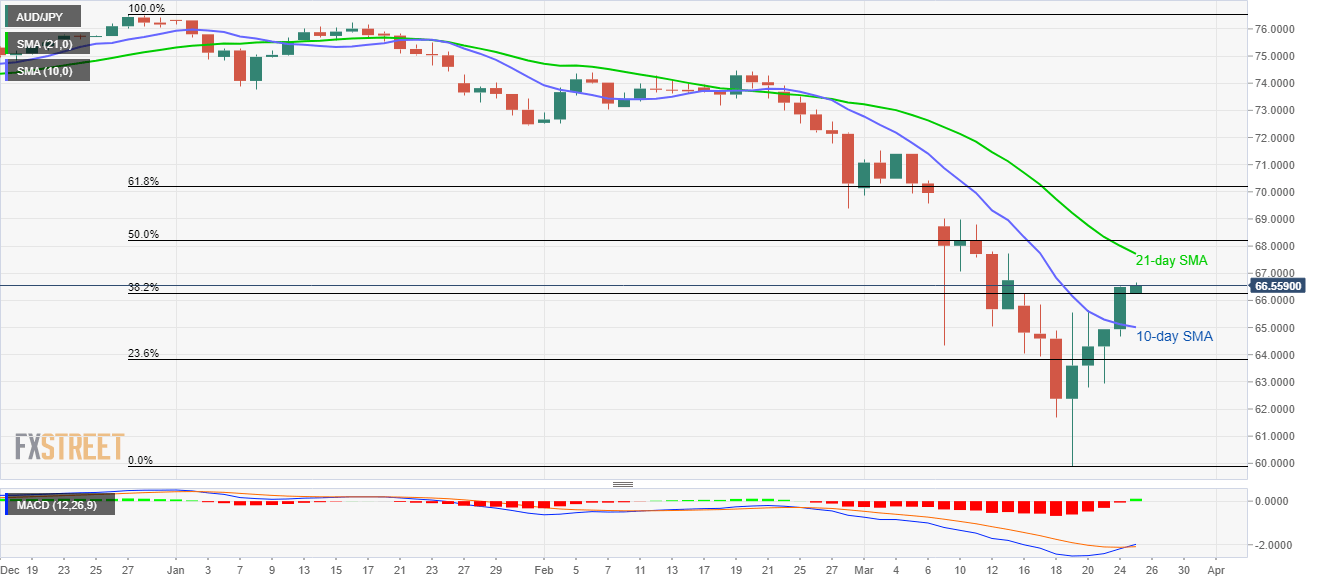
Following its sustained break of 10-day SMA, AUD/JPY remains 0.35% positive around 68.55 amid the early Asian session on Wednesday. In addition to the successful clearance of the short-term SMA, bullish MACD also favors the buyers.
As a result, traders will now target the 21-day SMA level around 67.70 during the further upside. However, the March 09 gap around 69.00 and 61.8% Fibonacci retracement of December 2019 to March 2020 fall, near 70.20 could challenge the bulls afterward.
In a case where the AUD/JPY prices remain positive after 70.20, January month low near 72.45 will return to the charts.
On the downside, a daily closing below the 10-day SMA level of 65.00 will renew selling pressure towards 23.6% Fibonacci retracement figures around 63.80.
However, 62.40 and 61.70 could stop the bears from revisiting the previous week’s low near 59.90.
AUD/JPY daily chart
Trend: Bullish