Back
23 Jul 2020
Gold Price Analysis: XAU/USD retreats by $10 from session high
- Gold has pulled back to $1,867 from the session high of $1,877.
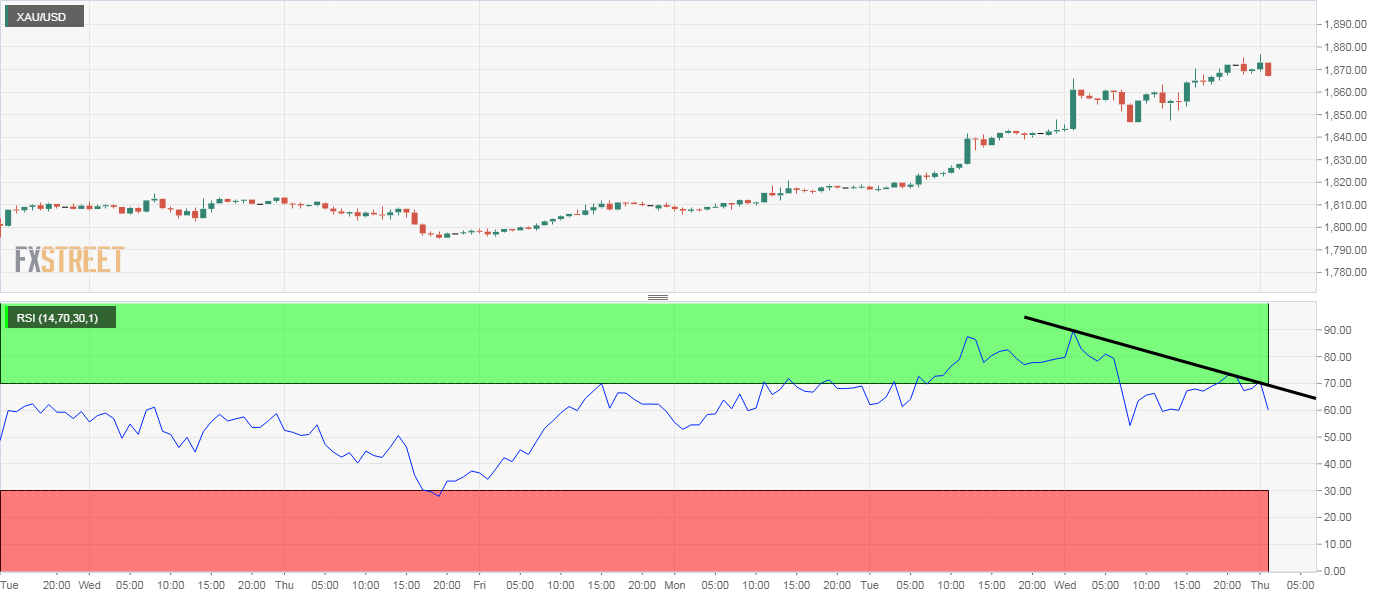
- The hourly chart shows a bearish divergence of RSI.
Gold is currently trading at $1,867, having clocked a nine-year high of $1,877 an hour ago.
The hourly chart now shows a bearish divergence of the relative strength index (RSI). A similar pattern is observed in the 4-hour chart. Further, the 14-day RSI is reporting overbought conditions with an above-70 print.
As such, the pullback could be extended to the ascending 10-day simple moving average (SMA), currently at $1,841.
The overall bias would remain bullish as long as prices are holding above the higher low of $1,795 created on July 16.
Hourly chart
Trend: Overbought
Technical levels