USD/JPY Price Analysis: Bounces off key 105.50 support after symmetrical triangle breakdown
- USD/JPY attempts a minor bounce following a bearish break.
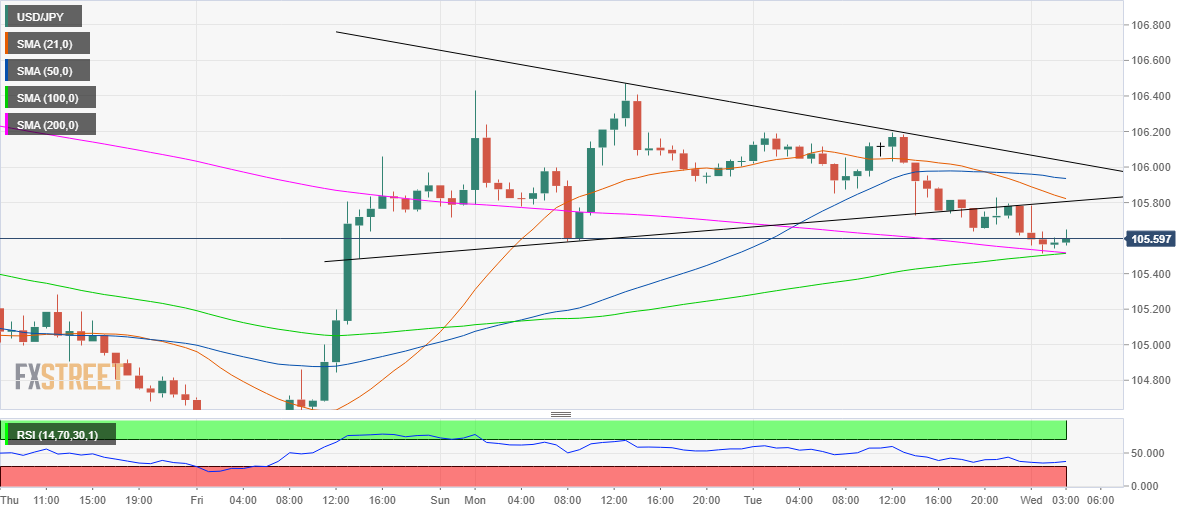
- Symmetrical triangle breakdown spotted on the hourly chart.
- Hourly RSI rebounds, still remains in the bearish region.
Fresh bids emerged at the critical support of 105.50, allowing a tepid bounce in USD/JPY over the last hour. That demand area is the confluence of the bearish 200-hourly Simple Moving Average (HMA) and upward-sloping 100-HMA.
The hourly Relative Strength Index (RSI) has rebounded from lows around 35 region but still remains in the bearish, suggesting that the recovery in the spot could lack follow-through.
The spot charted a symmetrical triangle breakdown on the hourly sticks late Tuesday, following a breach of the rising trendline support, then at 105.75. The 21 and 50-HMA bearish crossover also added credence to the downside break.
Should the bears give away the aforesaid crucial support at 105.50, a test of the pattern target below 105.00 will be inevitable.
On the top side, the recovery momentum will gain traction only a sustained break above the 105.81 barrier, the convergence of the bearish 21-HMA and former pattern support now resistance.
The next hurdle awaits at the horizontal 50-HMA of 105.93.
USD/JPY: Hourly chart
USD/JPY: Additional levels