US Dollar Index Price Analysis: Bears prepare for a bumpy ride near 90.00
- DXY refreshes weekly low but defends 90.00 threshold.
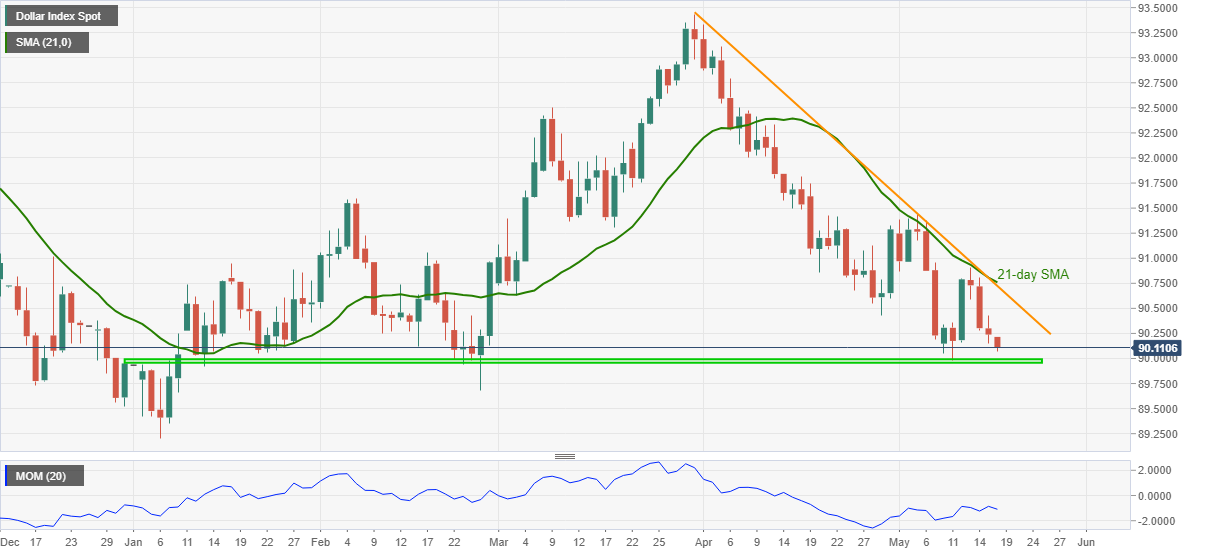
- Yearly horizontal support tests sellers, confluence of seven-week-old resistance line, 21-day SMA restricts short-term upside.
US dollar index (DXY) bounces off intraday low, rather weekly bottom, while picking up bids near 90.11 during early Tuesday. Even so, the greenback gauge remains 0.14% down on a day by the press time.
Given the quote’s sustained weakness from the short-term SMA and key resistance line, DXY is on the way to re-test the yearly horizontal support near 90.00–89.95.
It should, however, be noted that multiple supports can test DXY bears, also the likely oversold Momentum line, during the gauge’s further weakness below 89.95, a break of which will challenge February low near 89.70.
On the contrary, 90.50 may entertain the intraday buyers in case of a corrective pullback ahead of highlighting the 90.75 resistance confluence.
If at all DXY jumps above 90.75 on a daily closing basis, the monthly peak surrounding 91.45 will be in the spotlight.
DXY daily chart
Trend: Bearish