USD/TRY Price Analysis: 10-DMA, June’s top challenge further downside above $8.8000
- USD/TRY remains lackluster after three-day downtrend that broke short-term rising channel.
- Four-month-old horizontal support, immediate moving average probe bears, firmer RSI adds to the bullish bias.
USD/TRY dribbles around mid $8.8000s ahead of Tuesday’s European session.
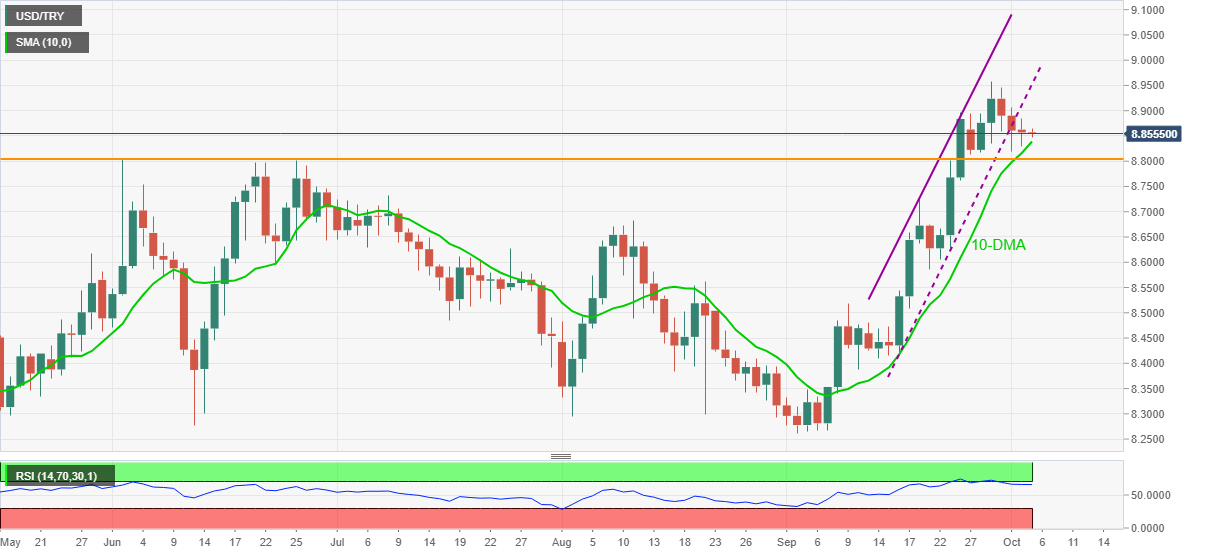
The Turkish Lira (TRY) pair recently defied a bullish chart pattern but 10-DMA questions the bears around $8.8390.
Also acting as the key downside support is a horizontal area comprising multiple tops marked in June surrounding $8.8050 and $8.8020, not to forget the $8.8000 threshold.
In a case where the USD/TRY prices drop below the $8.800 round figure, bears won’t hesitate to aim for June’s top surrounding $8.6820.
Meanwhile, recovery moves need to jump back towards the previous support line of an ascending trend channel from September 16, near $8.9500.
However, the latest top near $8.9600 will probe the USD/TRY bulls afterward, a break of which will direct them towards the $9.000 psychological magnet.
USD/TRY: Daily chart
Trend: Corrective pullback expected