AUD/NZD Price Analysis: Bulls waiting to pounce
- AUD/NZD bulls are in accumilaiton at this juncture.
- Bulls look to the M-formation's neckline and await breakout signals.
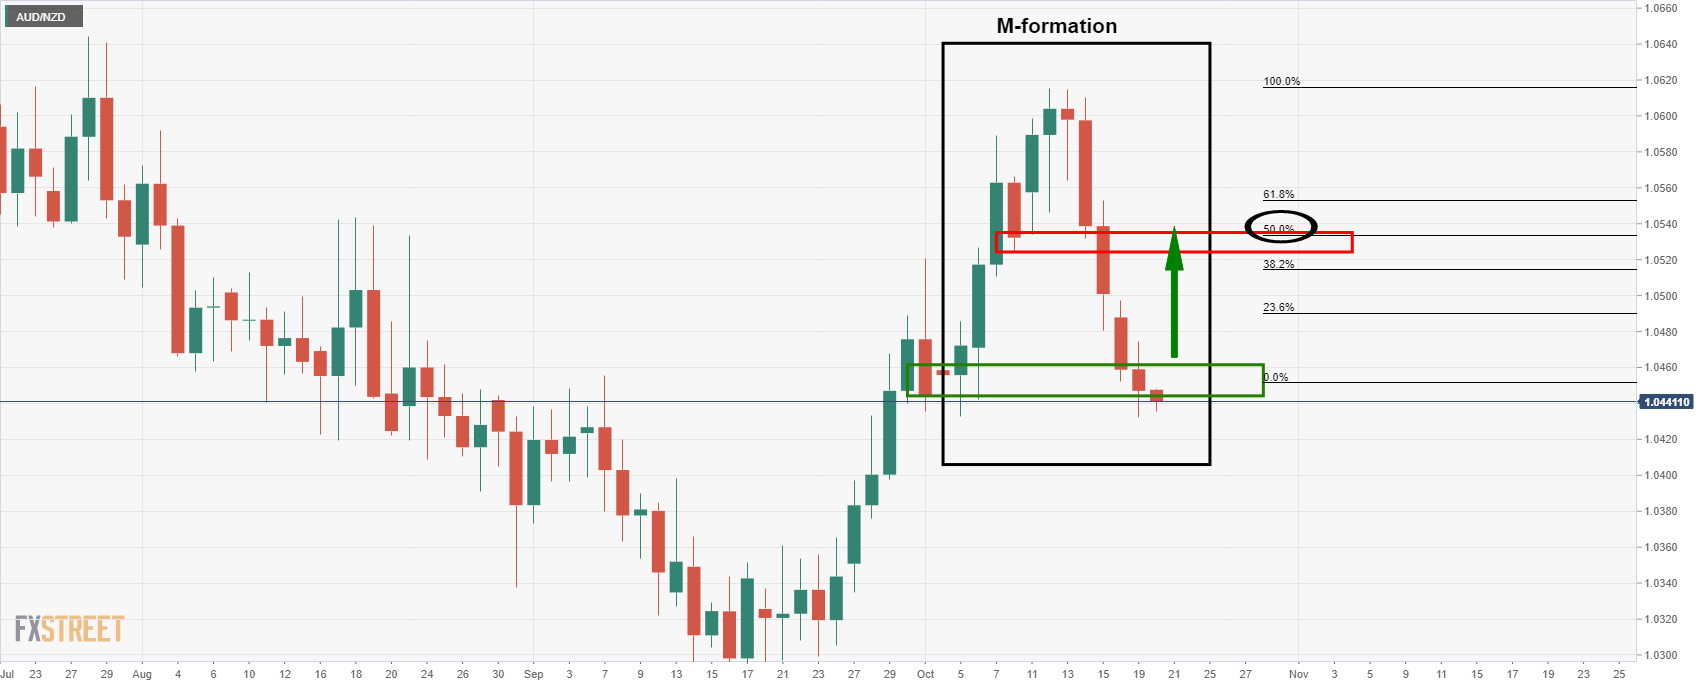
As per the prior analysis, AUD/NZD Price Analysis: Traders, don't get caught out! the price is indeed showing all the signs that the downside is tiring. The following analysis illustrates the prospects of a retracement to the neckline of the daily M-formation. Additionally, we can start to see price action that resembles the Wycoff method in the accumulation phase.
AUD/NZD daily chart

The M-formation is a bullish reversion pattern that would be expected to draw in the price for a test of the formation's neckline. In this case, that level is the 8 Oct low at 1.0524.
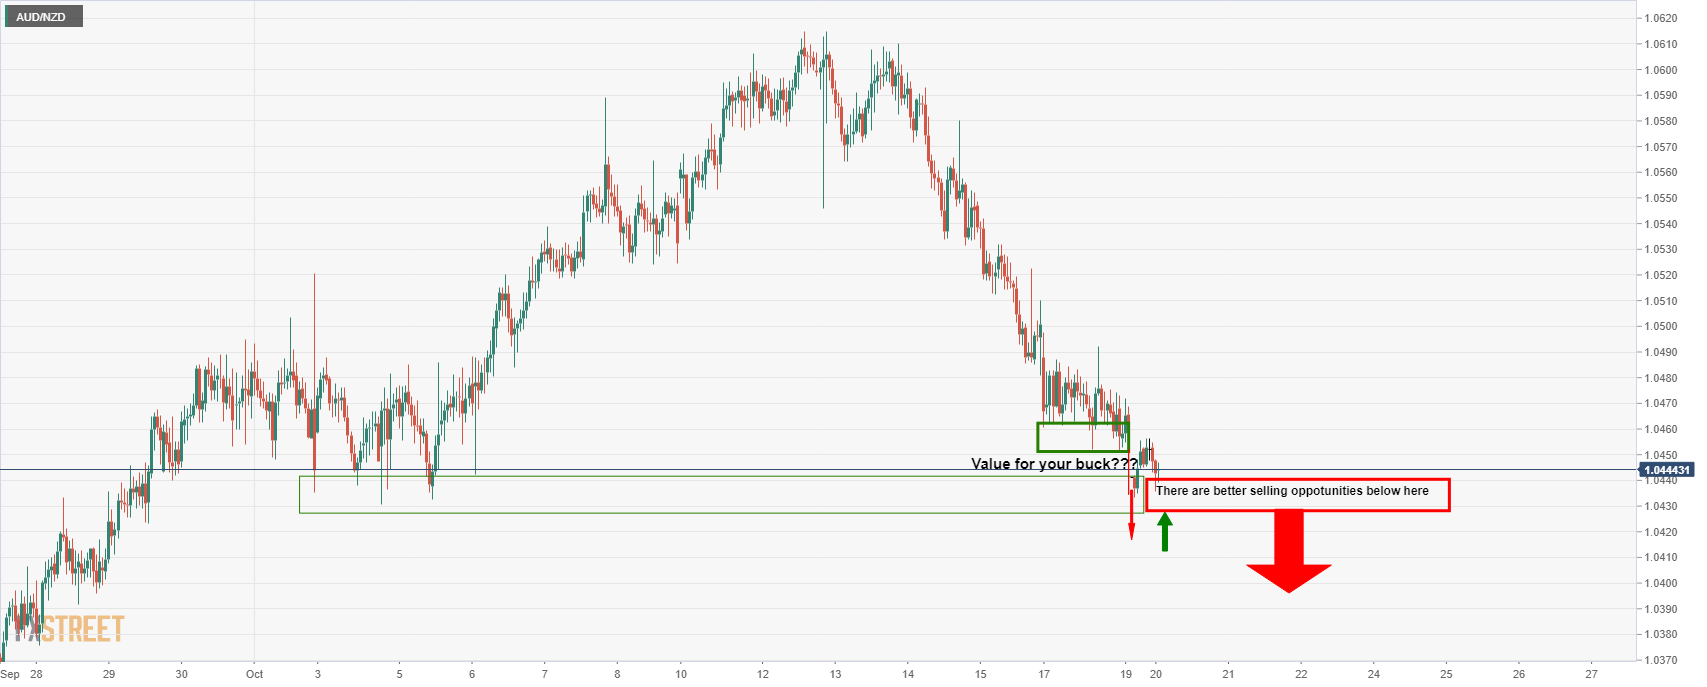
AUD/NZD hourly chart
While in the prior session's analysis, from an hourly perspective, the price went against the core projection. The expectations were for a move higher from the lower low. However, the door was left open for a test of the support zone between 1.0420/30 which has played out as follows:

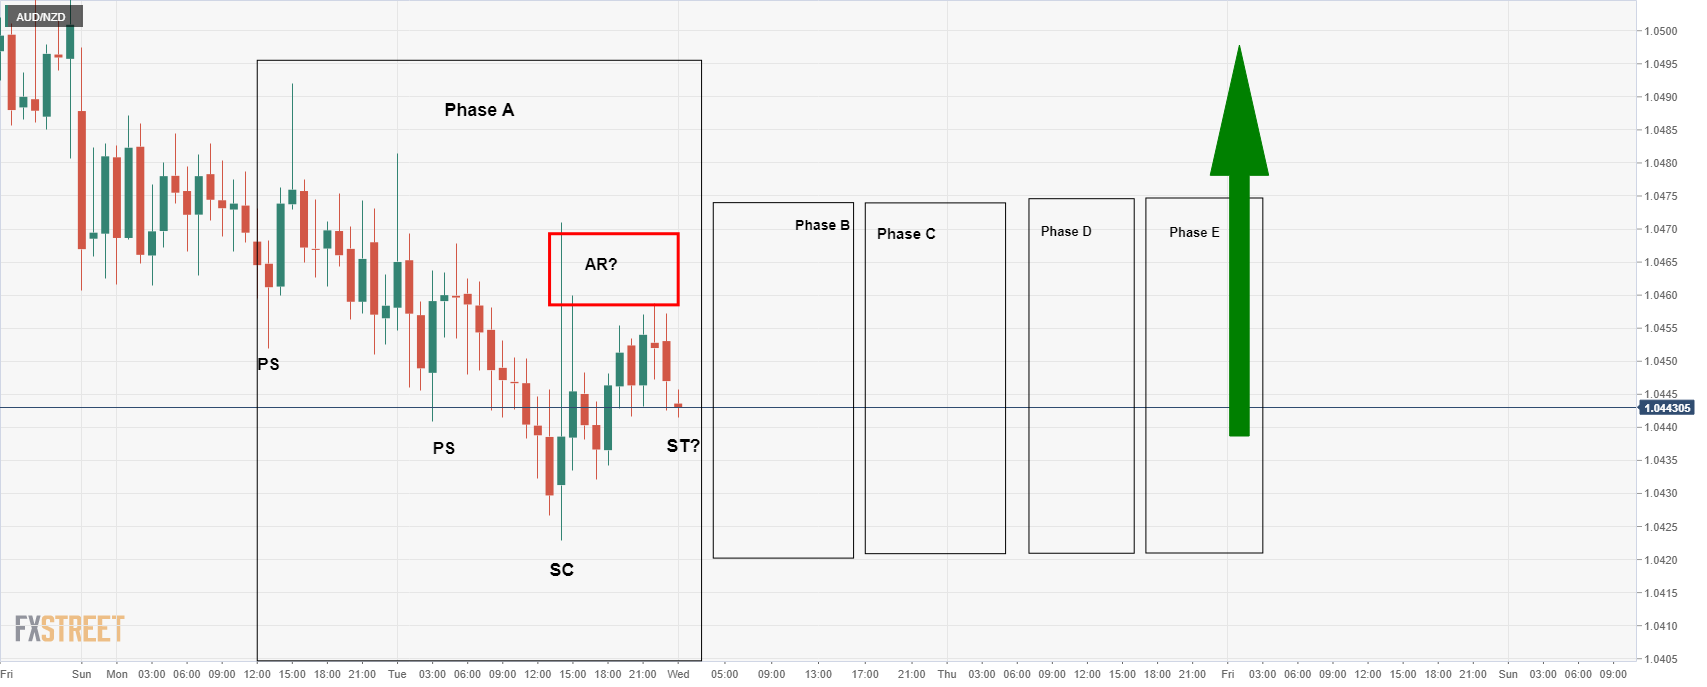
This brings us to the Wycoff Method:

The Wycoff accumulation methodology is a long-winded process but we have already seen Phase A potentially play out...
