USD/TRY Price Analysis: Consolidates around $9.59, weekly triangle in focus
- USD/TRY eases inside one-week-old ascending triangle amid bearish Momentum line.
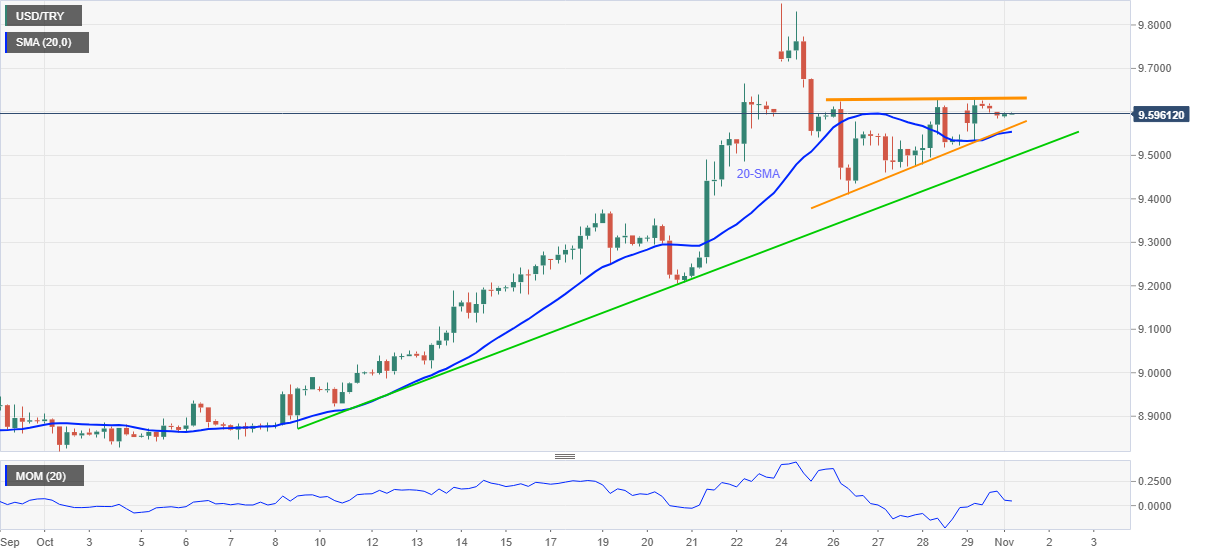
- Three-week-old rising support line challenge bears, bulls need $9.6330 break for run-up to refresh all-time high.
USD/TRY traders struggle inside a one-week-old bullish chart formation during the pre-European session on Monday. The pair’s consolidation from record top takes clues from a downbeat Momentum line, flashing 0.10% intraday loss around $9.5970 by the press time.
Even so, the support line of the stated triangle and 20-SMA challenge the pair sellers near $9.5540, a break of which will direct the quote towards an ascending support line from October 8, close to $9.4960 at the latest.
In a case where the USD/TRY consolidation lasts longer than $9.4960, the October 19 peak of $9.3765 will be in focus.
Meanwhile, bulls await a clear upside break of the $9.6330 level, comprising the resistance line of the stated triangle, to take fresh entries.
Following that, the latest record peak of $9.8505 and the $9.9000 threshold will gain the USD/TRY bull’s attention.
To sum up, the pair remains in a bullish consolidation mode and may correct further should it confirms the rising triangle breakdown.
USD/TRY: Four-hour chart
Trend: Further upside expected