USD/TRY Price Analysis: Further upside hinges on 13-day-old resistance break, US NFP
- USD/TRY remains steady around short-term resistance line amid overbought RSI conditions.
- Sustained trading above key SMAs keep buyers hopeful.
- Nonfarm Payrolls Preview: A strengthening labor market backs a tighter monetary policy
USD/TRY treads water around $13.80, down 0.26% intraday while consolidating weekly gains. That said, the Turkish lira pair snaps a three-day uptrend by the press time of Friday’s Asian session.
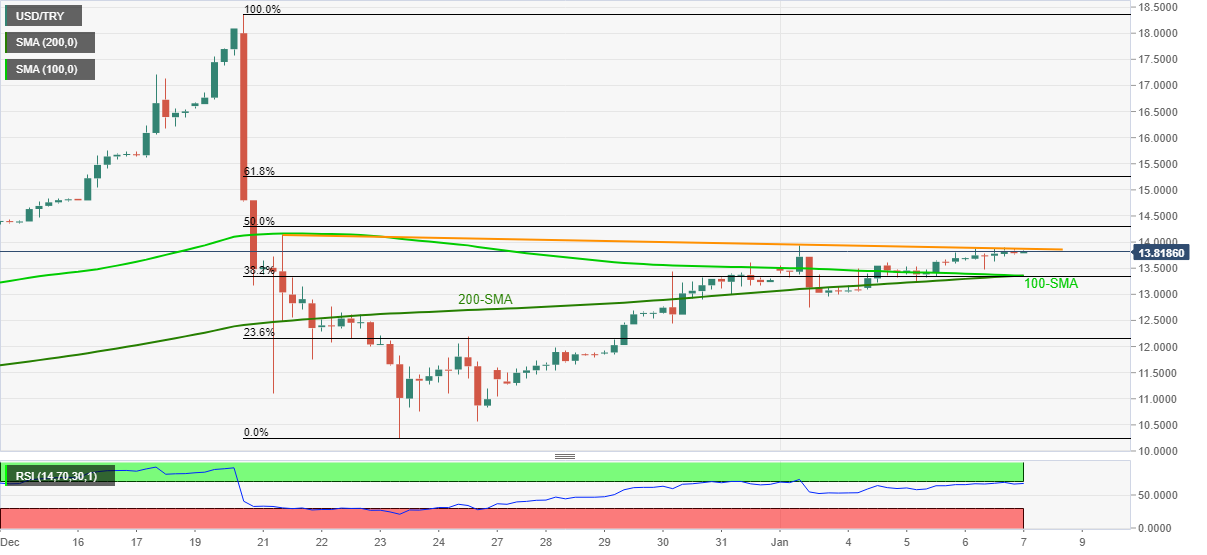
A downward sloping resistance line from December 21 restricts the immediate upside of the USD/TRY prices as the RSI line nears overbought territory. However, the quote’s successful trading beyond 100 and 200-SMA favor buyers on a key day.
It’s worth noting that a clear run-up beyond the aforementioned resistance line near $13.90 won’t be enough for the USD/TRY bulls as the $14.00 threshold will act as a validation point for the further advances.
Also challenging the pair buyers are the 50% and 61.8% Fibonacci retracement of December 20-23, near $14.30 and $15.25 in that order.
Alternatively, 38.2% Fibonacci retracement joins the 100-SMA and 200-SMA to highlight $13.35 as a tough nut to crack for the USD/TRY sellers.
Following that, the weekly low of $12.75 and 23.6% Fibonacci retracement level of $12.16 will be in focus.
USD/TRY: Four-hour chart
Trend: Further upside expected