USD/CAD Price Analysis: The price is taking on critical time-frame levels in the volatility
- USD/CAD bears are seeking an hourly downside extension.
- USD/CAD bulls are lurking at the daily support near 1.2750.
USD/CAD is attempting to break lower in US trade on Thursday. However, as illustrated in the following charting analysis, there are critical areas of resistance and support to keep in mind as well as reversion patterns.
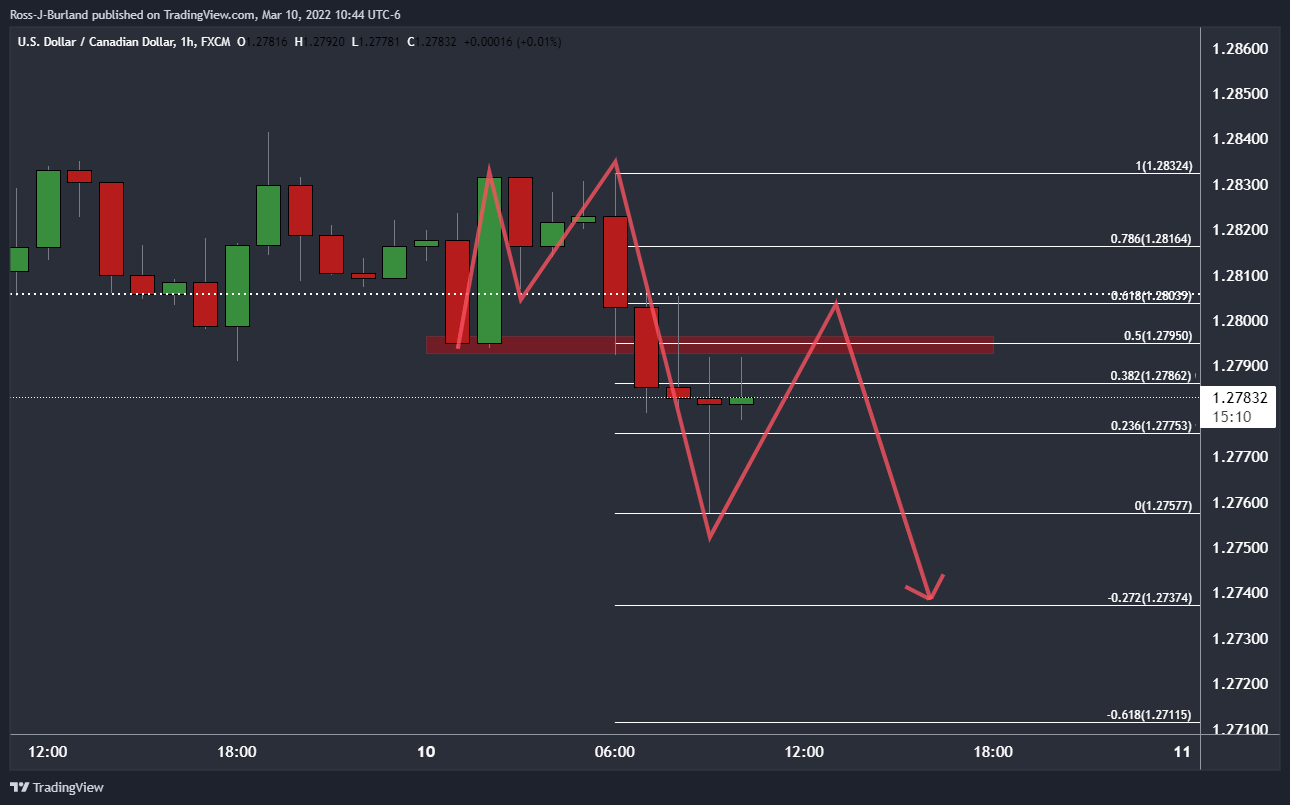
USD/CAD H1 chart

On the hourly chart, there is an M-formation that is playing out. The price would be expected to be hamstrung to the prior support being the neckline of the M-pattern. However, it is an overextended M-formation, so the reversion may only get as far as the last support near 1.2795.
The wicks of recent hourly candles within the bearish impulses have come close already. Therefore, an hourly close below 1.2770 could be seen to nullify the reversion pattern and the focus will be on the downside. 1.2770 is a significant level as it is -61.8% of the length of the initial bullish leg of the M-formation:

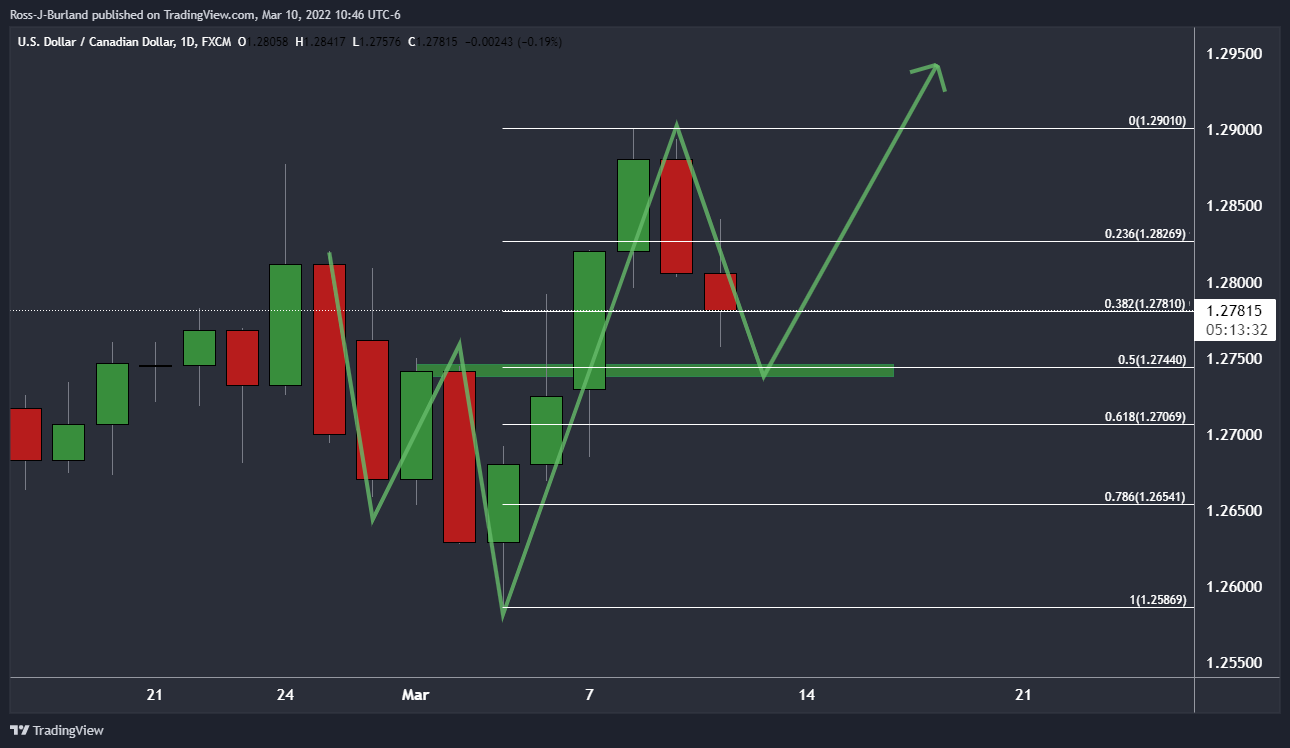
USD/CAD daily chart

Meanwhile, from a longer-term perspective, the daily chart is showing that the price is running towards the neckline of the W0formaiton, as illustrated in the above chart. From there, should demand move in, then a bullish continuation could be on the cards for the foreseeable future.
