WTI Price Analysis: Recovery remains elusive below $100.00
- WTI snaps two-day downtrend inside immediate triangle, grinds higher of late.
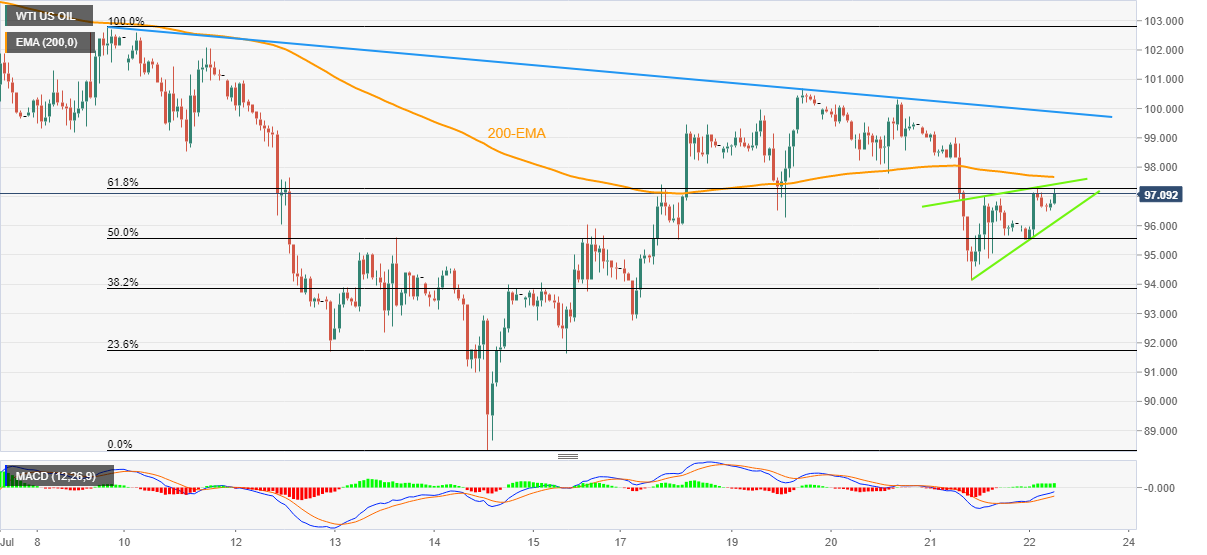
- 200-EMA, two-week-old descending trend line restricts immediate upside.
- Bullish MACD signals, sustained bounce off $94.12 favor buyers.
WTI grinds higher around the daily tops near $97.00 as it snaps a two-day downtrend during early Friday morning in Europe. In doing so, the black gold remains firmer inside an immediate ascending triangle formation.
Given the bullish MACD signals and the quote’s recent bounce off $94.10, buyers are likely to keep the reins.
However, a successful break of the two-week-old resistance line, near the $100.00 threshold, appears necessary for the WTI bull’s conviction.
That said, the aforementioned triangle’s resistance line and the 200-EMA, respectively around $97.45 and $97.70, guard the quote’s immediate upside.
In a case where the black gold rises past $100.00, the July 08 swing high near $102.80 and the monthly high of $109.53 could gain the market’s attention.
Alternatively, pullback moves need validation from the lower line of the stated triangle, at $96.10 by the press time.
Following that, a downward trajectory towards the $94.00 and 23.6% Fibonacci retracement of July 08-14 downside, near $91.75, can’t be ruled out.
It should be noted that the WTI’s weakness past $91.75, could make it vulnerable to refresh monthly low, close to $88.30 at the latest.
WTI: Hourly chart
Trend: Further recovery expected