AUD/USD Price Analysis: Bulls are coming up for air following big sell-off
- AUD/USD could be primed for a bullish correction prior to the next leg to the downside.
- Bears have the 0.6713, 0.6699 and 0.6682 levels in their sights.
If the market doesn't just continue to freefall, then a correction in AUD/USD would be expected at this juncture. The following illustrates a potential flight path for the Aussie over the coming sessions, while also taking into consideration the key jobs data on Thursday.
AUD/USD daily chart
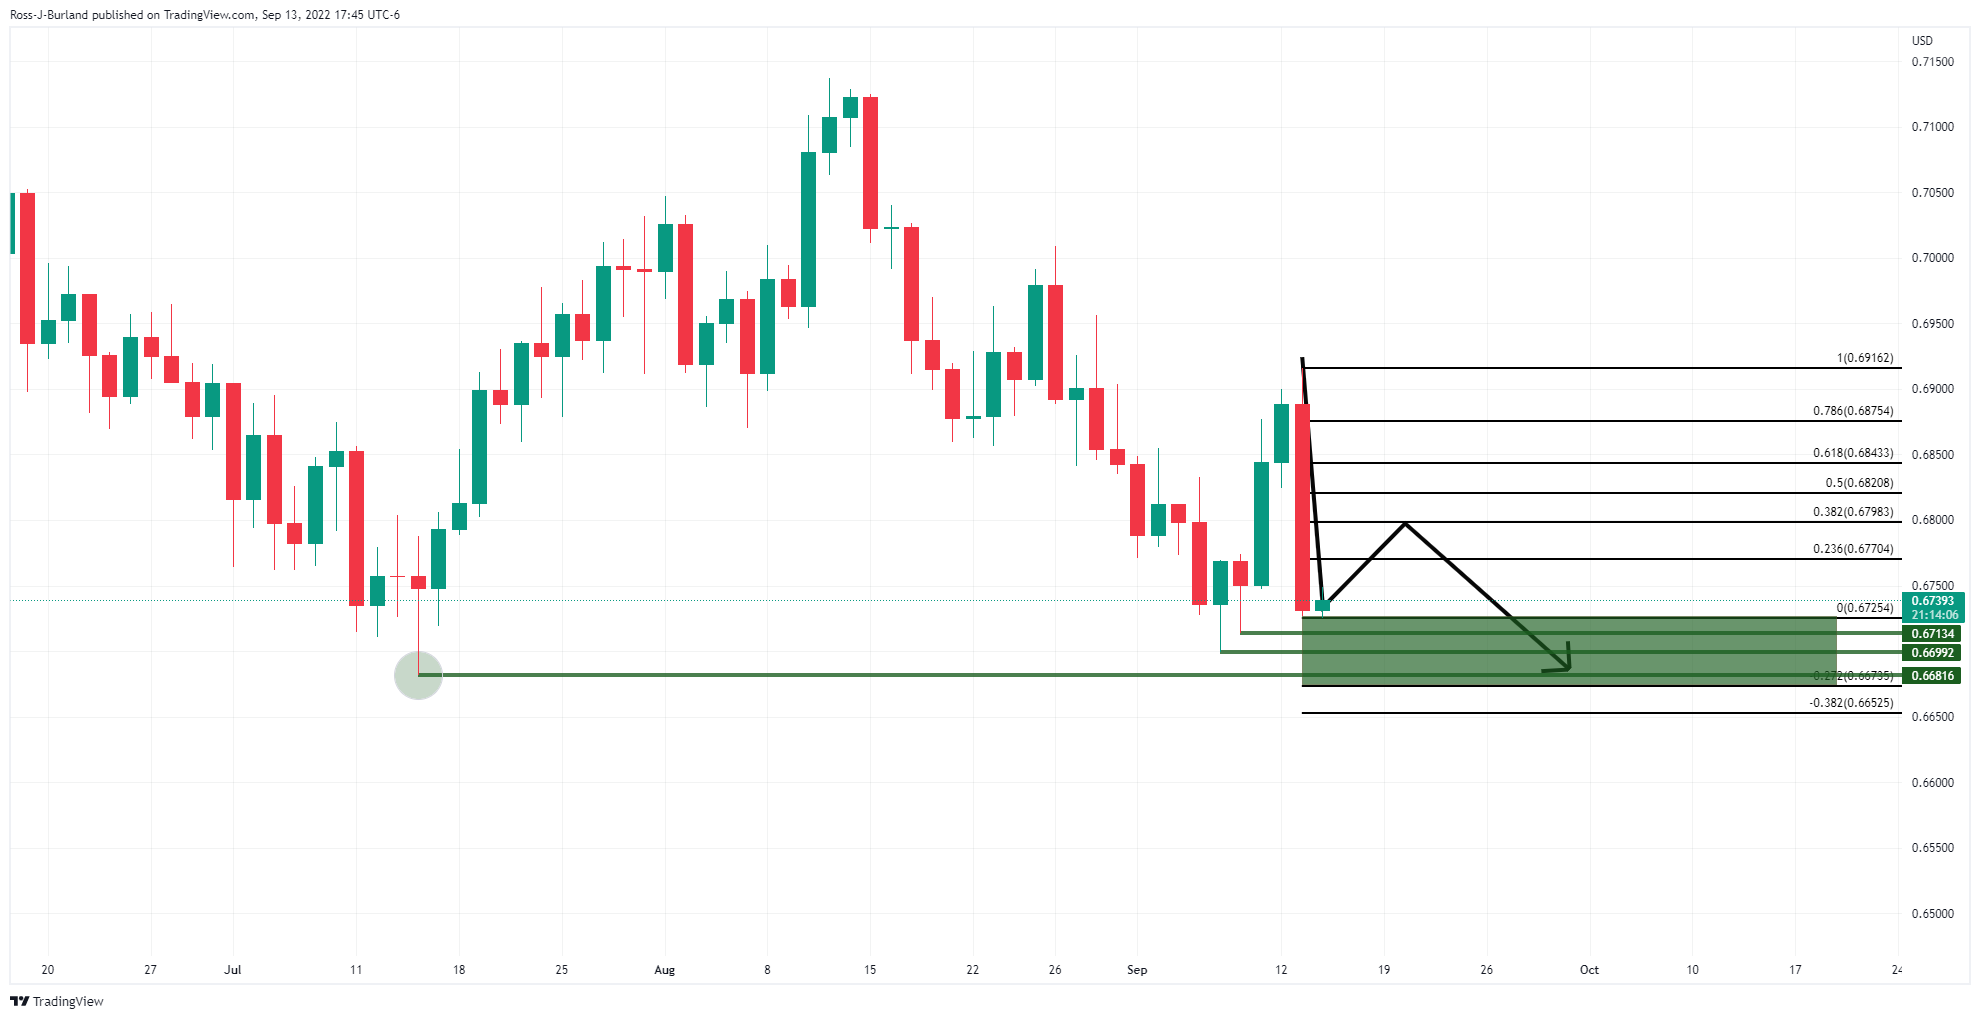
From a daily perspective, the bearish impulse is powerful and this is a falling knife. However, if the bulls do somehow manage to take back control, 0.6800 will be eyed as a current 38.2% Fibonacci retracement of the sell-off. In any scenario, the downside is favourable either before the correction or after and the 0.6713, 0.6699 and 0.6682 levels will be of interest as prior daily lows.
AUD/USD H1 chart
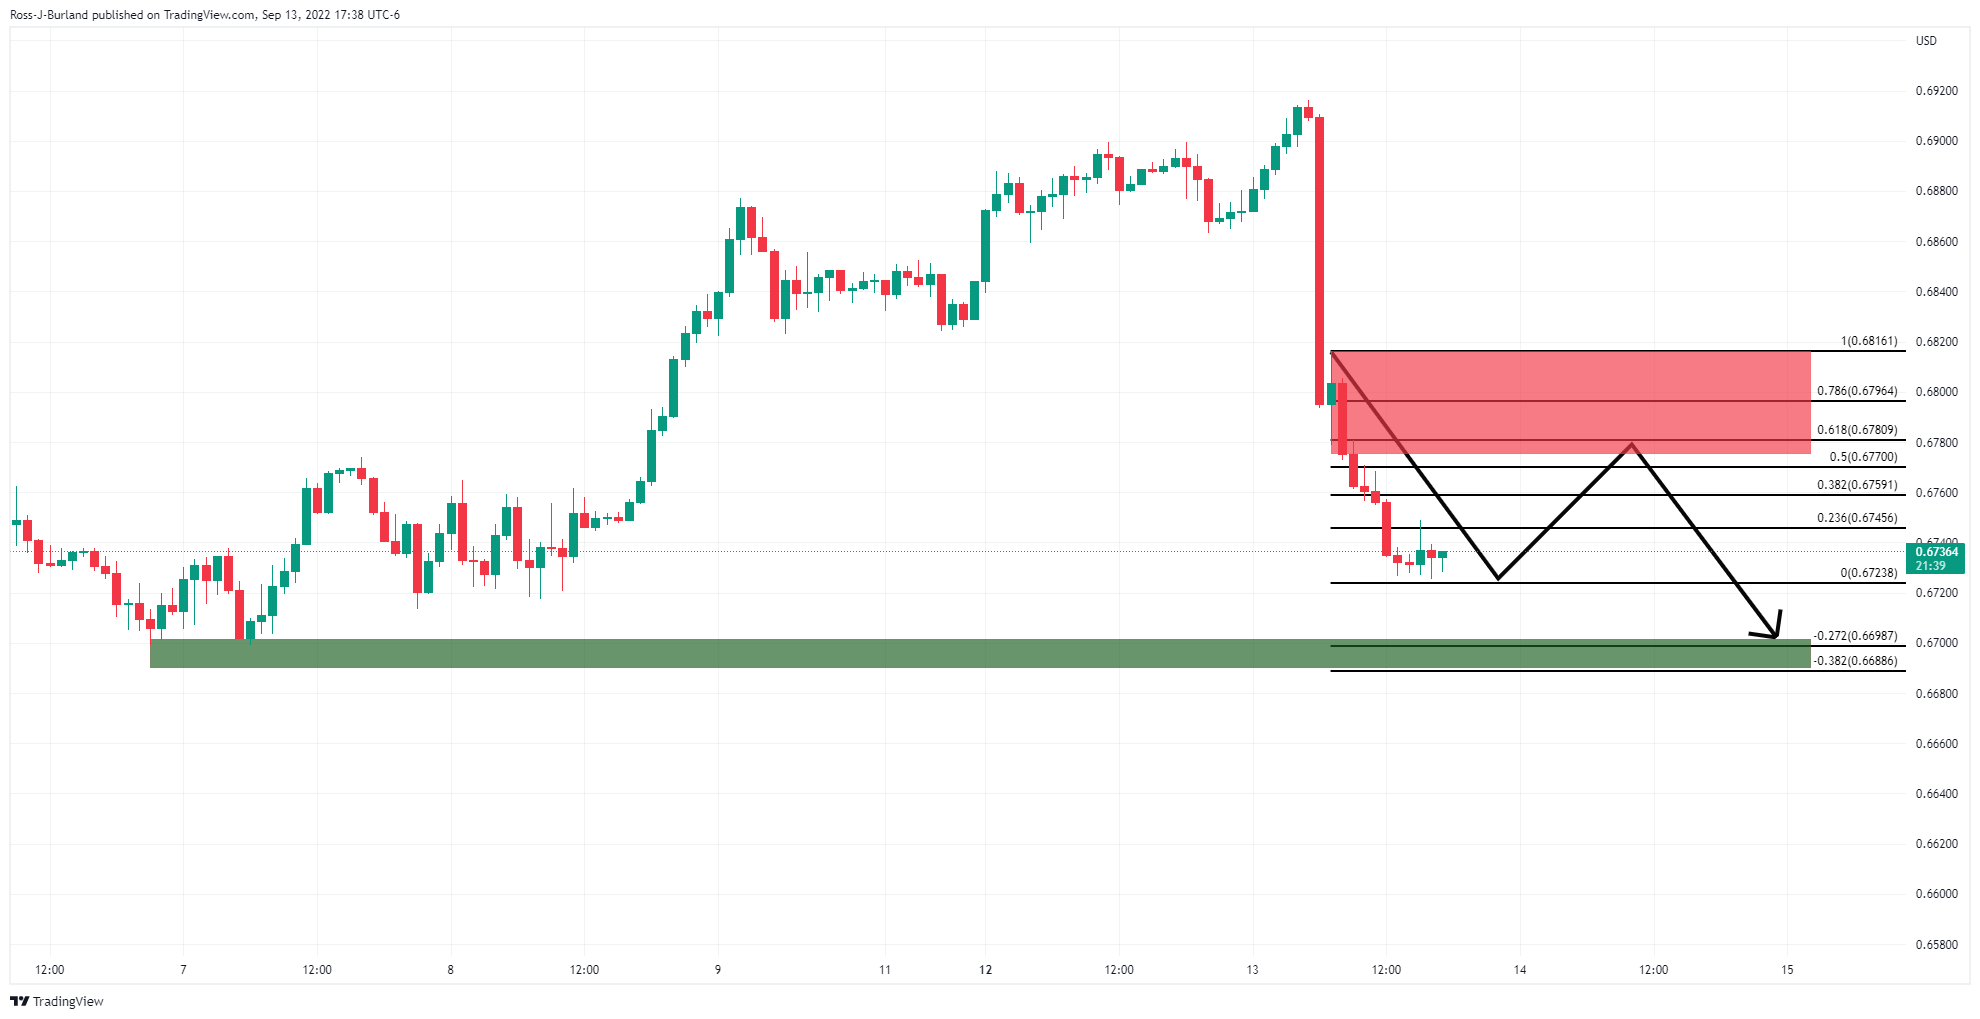
From an hourly perspective, the 38.2% of the hourly impulse is a touch beyond the midpoint of the 0.67 area guarding a deeper correction towards the 61.8% Fibonacci level around 0.6780 that has a confluence of the prior mid-way bounce (green candle).